I can calculate the count of Transactions per day with the grouping tools of a date & display transaction count from the grouping.
But is there anyway to actually create an additional column with the Count Data in it to display the Breakdown of the Groups Count Function?
But I need a way to create a view for myself which has the Calculated Transactions. The data may last todays date 100 times. I was essentially trying to use the Dates to count as a transaction count.
I hope this makes sense. Would appreciate any help possible. I Think it would require some type of formula.
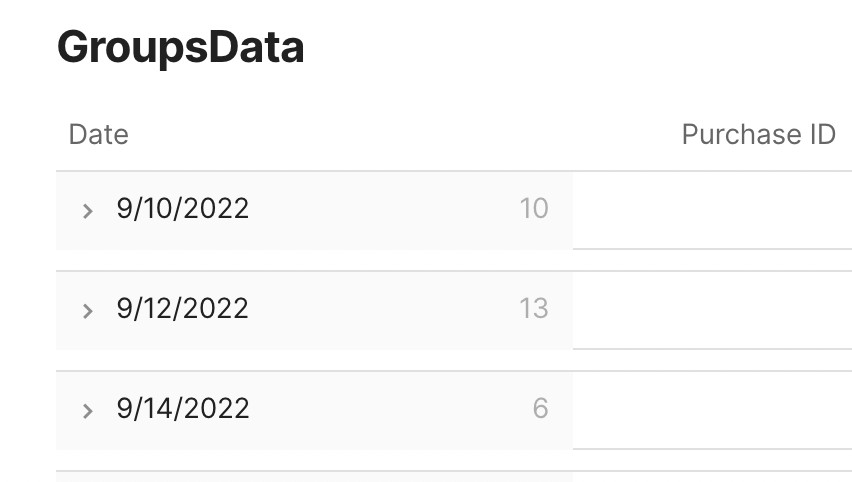
This is not the same data but it is showing the Count Data as it is in Coda. Just trying to be able to automatically extract the Dates / Counts that the Dates appear in the Grouping tool of a row.
Hello @End_Your_Search!
It is possible to add a column to your table, with the next formula:
thisTable.Filter(Date=thisRow.Date).Count()
What this does is filter the transactions table by all the dates that match that row’s date then it counts them
But I don’t recommend it as it would calculate the same formula for every transaction and this would slow down your doc faster as your transactions table gets bigger.
I would create a separate table with all the dates and calculate it from there.
I think im onto something with it & thanks for poiinting out about speed efficiency with large data sets. Greatly appreciate it.
If I am trying to pull in the Dates, into a Row automatically from another Table. I was planning on trying to pull it in this way.
Unique(GroupsData.Date)
But it seems that it just repeats all of the dates individually. In combination with what you wrote and this approeach I am trying to automatically Generate the Dates based on my data.
Thanks again Saul this will make me very excited once I understand this. I am just wanting to automatically only pull in each Date 1 time, not duplicating dates. Obviously because in some cases I have 100+'s of transactions on the same date.
It makes total sense! That is exactly what the button does, it even uses the Unique() you used.
Now then, first you need to get all the dates
Transactions.Date
Then you get all the Unique dates
Transactions.Date.Unique()
After that you add a row on another table for each date
 Transactions.Date.Unique().ForEach(
   [Transactions per day].AddRow()
 )
But you have to add each row with their date, so when adding them you set the date for each date, for this we use CurrentValue
Transactions.Date.Unique().ForEach(
  [Transactions per day].AddRow(
    [Transactions per day].Date,
    CurrentValue
  )
)
Now this works but we don’t want to keep adding the same dates everytime we press the button so instead of using
Transactions.Date.Unique()
We take into account what we already have in the new table so it doesn’t add them again so we filter them out
Transactions.Date.Filter(
  CurrentValue.Contains(
    [Transactions per day].Date).Not()
).Unique
This way, we end up with the formula that is already in the button
Transactions.Date.Filter(
  CurrentValue.Contains(
    [Transactions per day].Date).Not()
).Unique().ForEach(
  [Transactions per day].AddRow(
    [Transactions per day].Date,
    CurrentValue
  )
)
It makes alot of sense now, I cant see how the button settings are set, it only shows View Access. Do you mind sharing the settings of the button?
Im sorry im super brand new to Coda and greatly appreciate all the effort in showing me this example. All of the examples I had been looking at in videos did not really cover this I felt.