Hi folks !
As requested by @Paul_Danyliuk in twitter, and after a few hours playing with Paul’s Trick, I share here a few use cases to generate cool and fully automatized CODA svg.
Given the possibilities, I keep on investating in the several possibilities and use case possible. Please reach me out if you have any ideas/wish for me to work on !
I’ve planned to prepare a full tutorial article in the coda community forum, and also in my blog, to present in detail how you can generate colored map (or whatever svg you want) and also gantt chart
Obviously all those svg’s are dynamically interfaced with coda data, so that this is all automatic, and linked with your information.
Till I finish to write those detailed articles, please find a few view screenshot of the achievement ![]()
Polar coordinates dataviz
- Use case : Any dataviz you want, with gradient-colored design (with a beating hearth, what a poet !)

Custom Colored SVG Map
- Use case : show gradient data through a country map, or industrial process with you process svg/dwg map

Time-Animated Map to show data evolution
- Use case : same than above, with time evolution

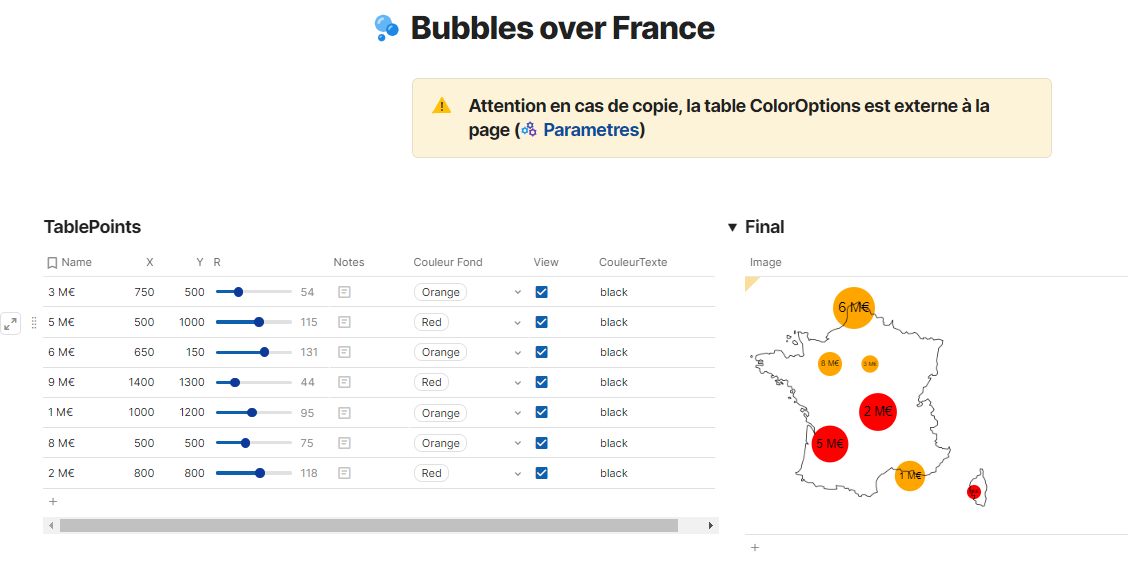
Bubble over Map
- Use case : target cities or locations, and show values with bubbles and moving size according to values
Gantt Chart Project Management
- Use case : track your planning project, with visual progress bar fully linked to your task
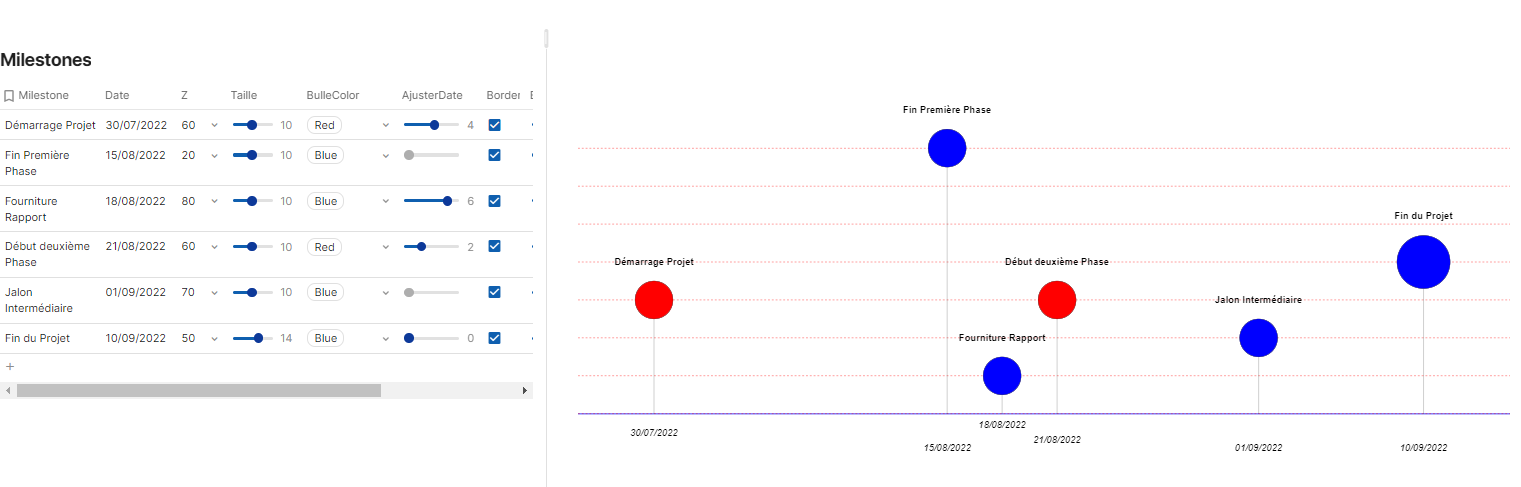
** Milestone tracker**
- Same than above, but easier
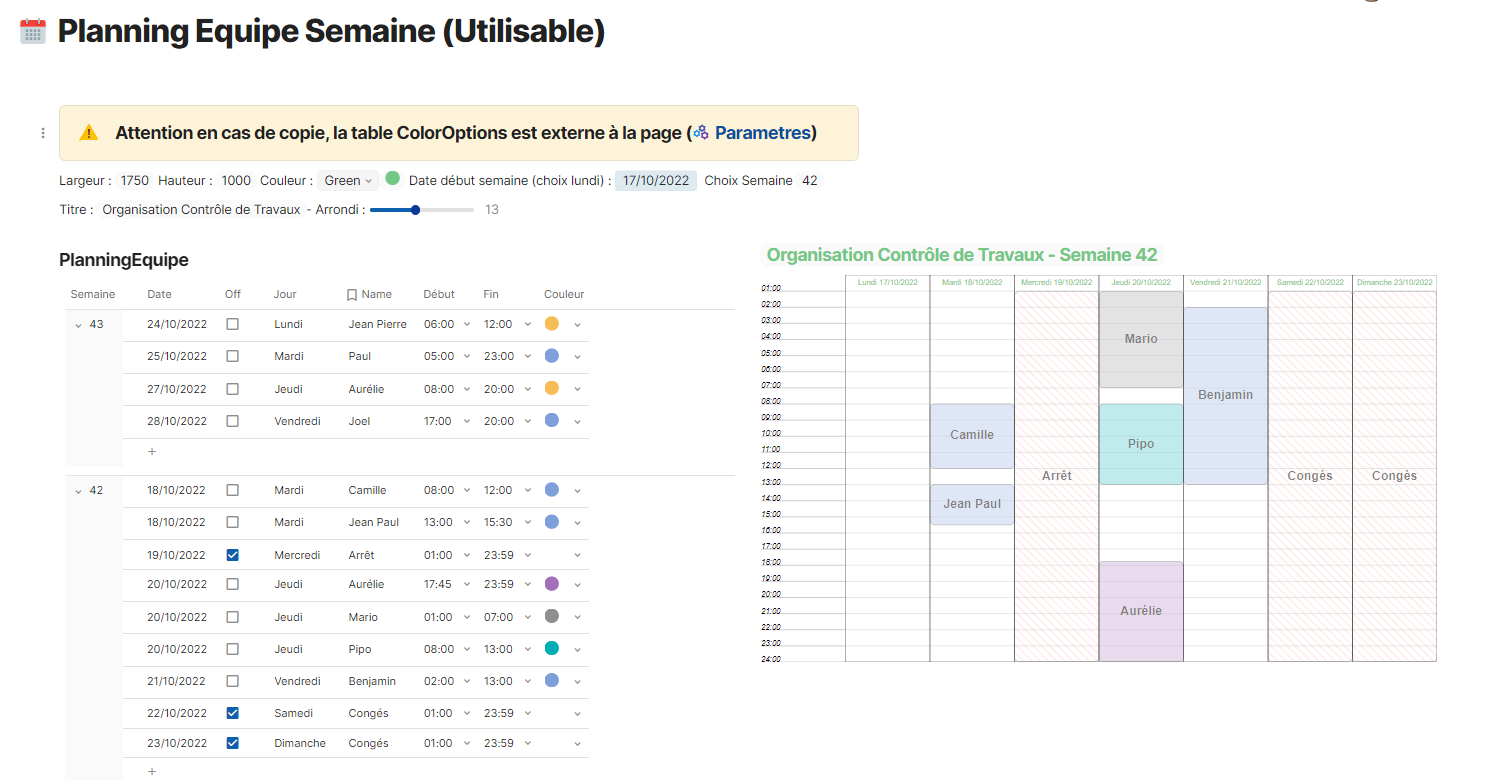
Weekly team planner
- Use Case : Team management, room/car management, classroom and schedule