Note: This applies to you if you’re a power user who builds large complicated docs AND also need to access those via API (incl. Zapier or Cross-doc), and had already hit the current 125 megabyte API access limit in the past. If you are a regular Coda user who have never experienced these kinds of problems, please don’t apply what’s described below.
When I build my docs, I exclusively use Checkbox columns to display logical (on/off, true/false) data, even if those are formulas and not clickable controls. I was optimizing a doc recently and discovered the hidden cost of using such columns (also not just Checkboxes but any controls).
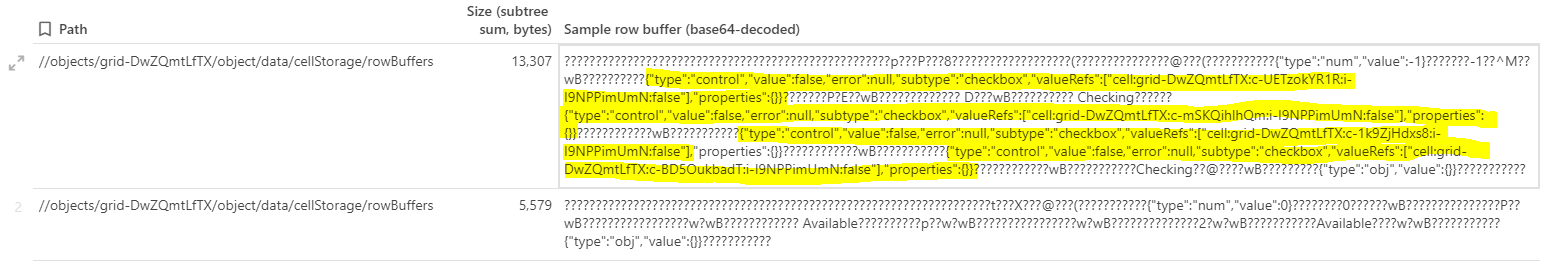
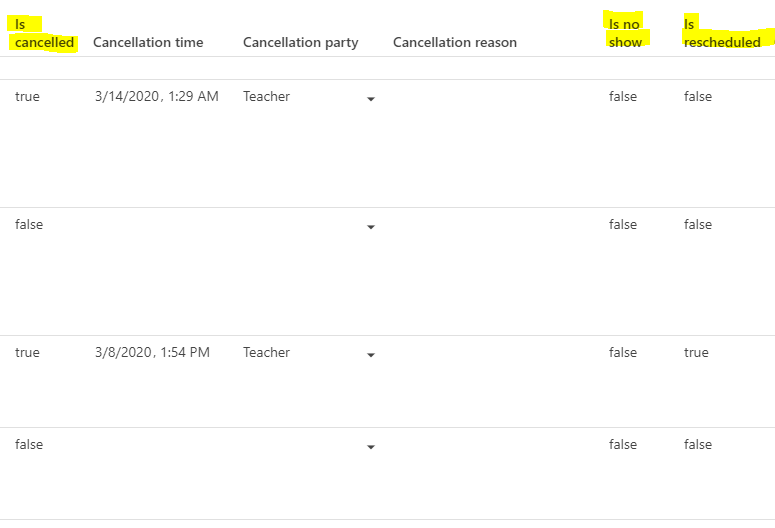
Here are the “before” and “after” versions of a row from the same table:
The difference is that in the “before” there are four Checkbox columns, and in the “after” it’s the same four logical columns but with their type changed to Text.
That’s ~150 bytes saved per row per column changed for regular tables, and even more for crossdoc tables (since the valueRefs part is much longer there).
Note that the values will still be logical true/false, not the "true"/"false" strings. I.e., they will test positively for .isLogical(). So it’s safe to keep using those in formulas; this column type change doesn’t affect anything but the way these are stored and displayed.
Again, this is a last resort measure. I did this today because I had to get our doc below the 125 MB API limit quickly so that its data could cross-doc to other docs. Don’t do this unless you absolutely have to. Remember that good user experience comes first, and premature optimization is a bad practice.
That is super valuable information. Thank you! I’ve also recently learned that the other hidden cost to checkboxes is that if you ever decide that you want to switch to more than one state (i.e. a selector) it can cause you to lose your CreationDate information, which can be really annoying!
Hey @Paul_Danyliuk, very interesting find. I’m curious to know how you extracted and then decoded base64 to measure this. Is there a hidden formula to accomplish this? Thank you
No hidden formula. I had to download the 0.json (schema) and 1.json (data) files, evaluate these as JSON, then decode individual rows as base64 to find more JSON+flat buffers. I hacked together a very basic Node.js script for that:
Use: node stats.js ./path/to/file/1.json
I’ve heard this kind of stats should be added to Coda somewhere soon, so you’ll be able to see this in the UI and not the way I had to do it.
This node script was a big help, thanks @Paul_Danyliuk !
I was able to determine which tables I needed to focus on most urgently in a maxed out doc (top table sizes were 52MB, 17MB, 5MB, and then a bunch in the 2’s and 3’s). While I wasn’t necessarily shocked about which table held the crown, it was helpful to know the magnitude of separation, and there were even some surprises among the medium-sized tables (there were a couple I thought would be heavier, and now I know any gains would be negligible and I can ignore them).
Buttons are the worst: they take even more space. But don’t let it hold you down. There’s no need to make premature optimizations if you’re not running into issues yet / not expecting huge amounts of data and/or long action formulas.
Hi @Paul_Danyliuk
is it possible to check the “cost” of a row reference vs. select list vs. text (e.g. for “status” column)?
I’m trying to optimize a large doc for mobile and noticed that changing the checkboxes to text helped a bit (coda is still quite slow on mobile unfortunately )
Is there any way of finding out the sizes of tables individually? I have the same API problem, with my document reaching 125MB mark. For the time being I have had to resort to segment my data based on Yearly quarters into separate documents. (Defeats the point of having something that does it all.)
I tried removing buttons, check boxes and such, but the size indicator doesn’t seem to update.


 )
)