Hi Coda Community,
I have a question that is probably basic to a lot of you but is really beguiling me for some reason.
I am trying to collect feedback data on a bunch of questions from stakeholders of my organization. I want to group the data by several factors.
- The type of question asked (i.e. what area of the organization was being asked about). I wanna show the average response regarding that question, and the type of question it was. e.g. I wanna know the average response to that specific question and the average response to all questions of that type.
- I wanna show average by stakeholder group. I wanna know how that question averaged (and differed) between the Board, Staff, External Stakeholders, etc.
So right now I have a table with the following columns: Question, Question Category, [Casper’s Response], [Geoff’s Response], [Sadia’s Response], and so on.
Then each row is e.g. Question: Is our brand rad enough?, Category: General, Casper’s Response: 5, Geoff’s Response: 3, Sadia’s Response: 4.
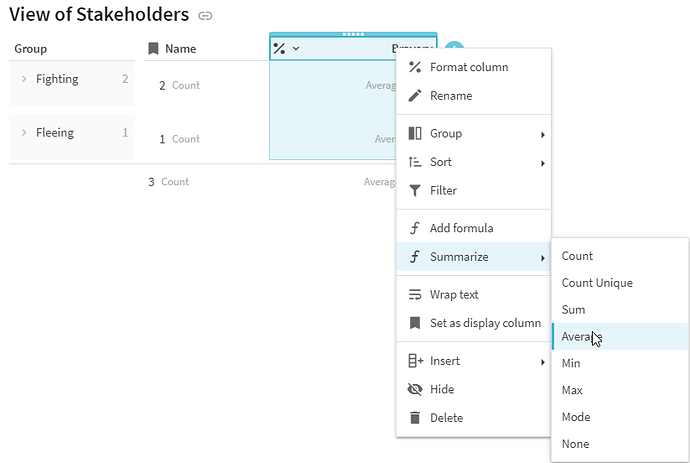
But now I want to add data to each of those columns about that person - the group they’re from. Casper and Geoff are from the Board, whereas Sadia is a staff.
How do I do this? I can’t add a row because the leftmost column are questions, and it’ll look like the rows below are also questions, even though they are other types of data. On some tables I’m going to want to filter out the questions when they’re not relevant, and leave just the categories of stakeholder.
I can’t get my head around this! I feel like I am misunderstanding a fundamental and key part of the Coda methodology by not understanding this. Can anyone help? Thanks for reading! Tim


