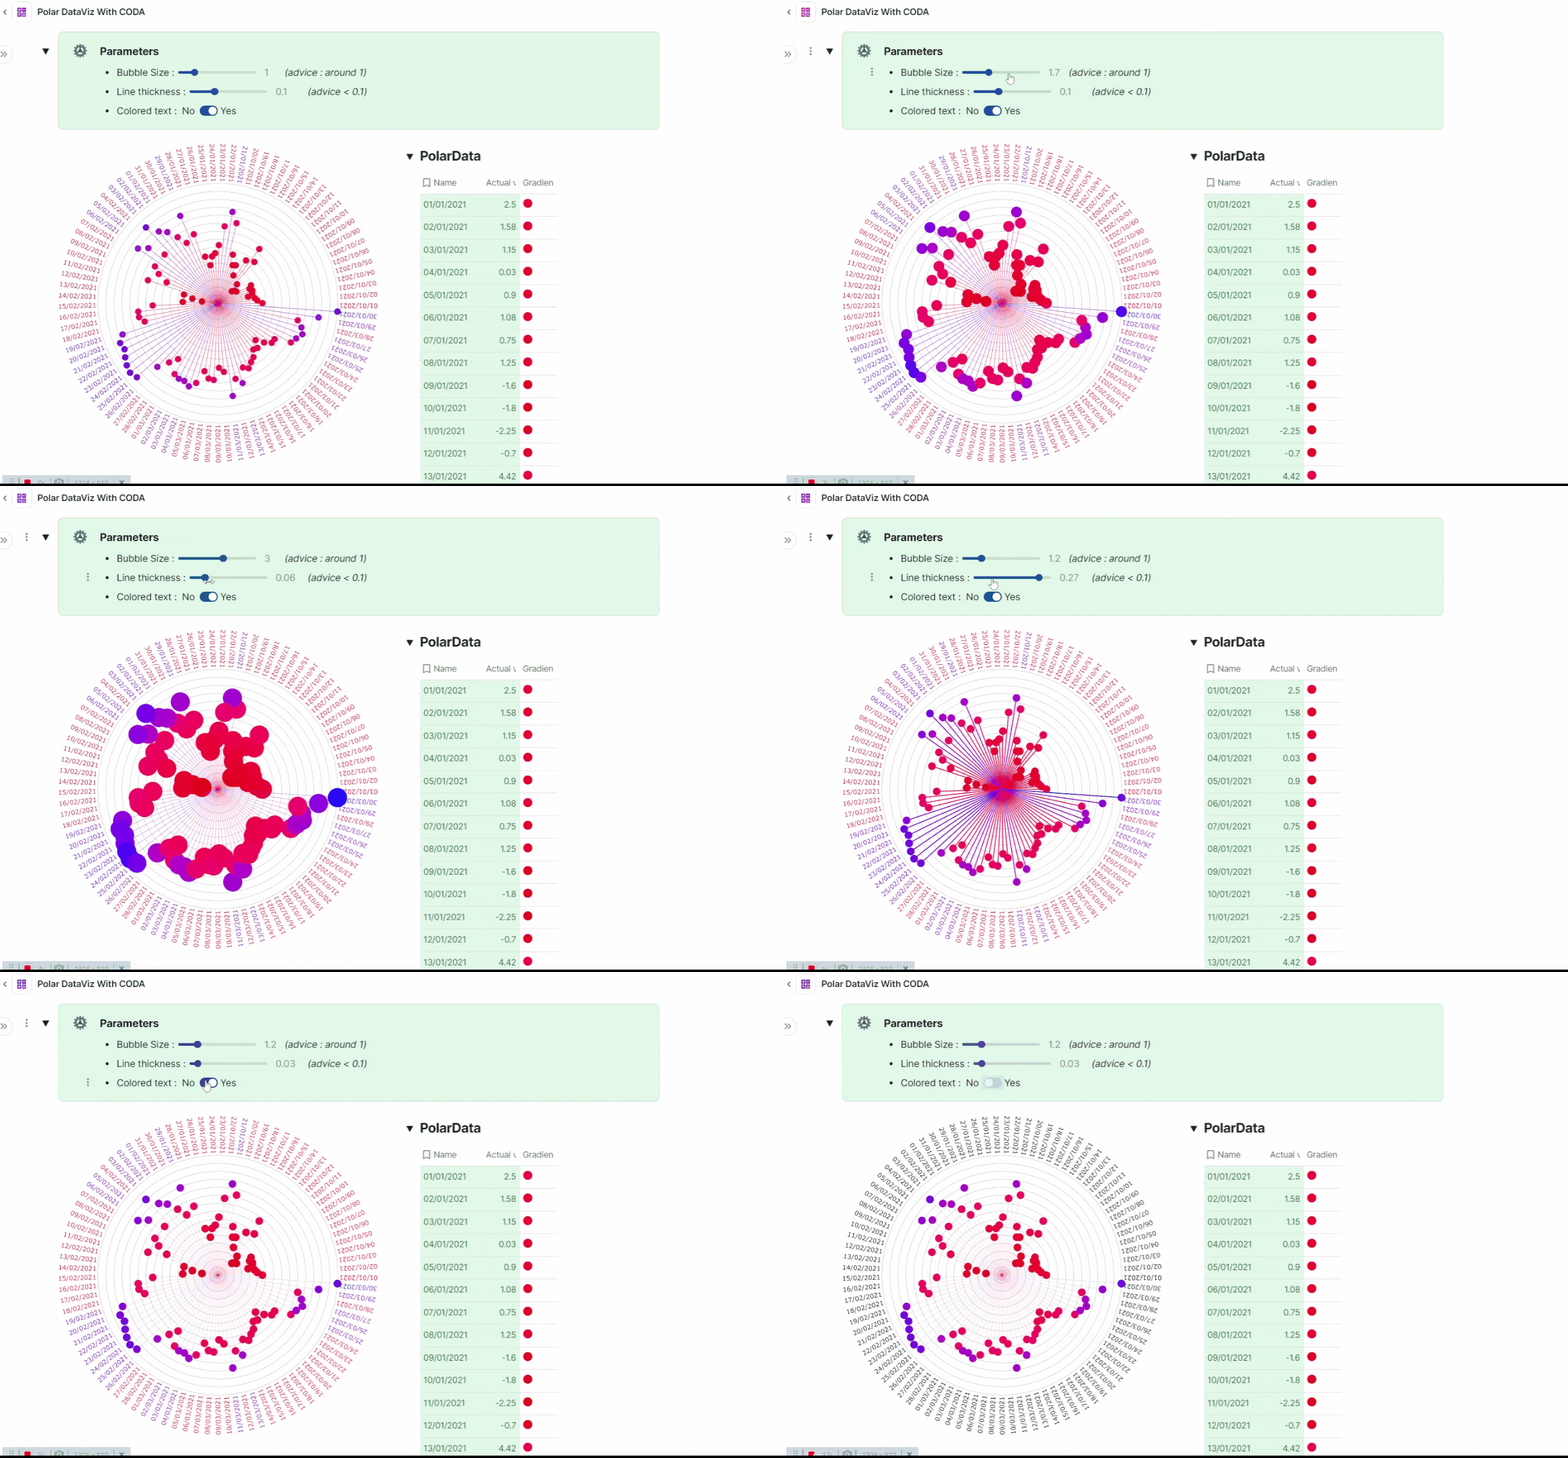
Hello community !
[Edit : v2 integrating Paul’s comment for more efficiency !! ]
As you may have seen, I’m having a good time recently creating svg from @Paul_Danyliuk trick about svg rendering. The possibility are endless, and I made my first creations about gantt diagram, map viz and also chart improvement ! Obviously, all of this is automatically linked to our coda’s data !
I’m happy to share a fully documented doc to generate one of my favourite dataviz : The 360° wheel

. I think this is a good use case, as the creation is made 100% in coda, without involving any external svg’s
Please, find the document embed, and also in my blog :
Please, feel free to ask questions if stuff aren’t as clear as I wished !
Enjoy !
7 Likes
Awesome job!
Yeah, calculating trigonometry through a pack isn’t the most performant thing. I’d rather not calculate the sines and cosines in Coda if I didn’t have to, but rather set transformations in SVG itself (you can make straight lines, wrap them in <g> groups and set rotation on the latter, specifying the angle and the pivot point IIRC) Then the browser would apply rotation natively and very fast.
You could actually put both the line, the dot, and the text label in such group (assume it’s not rotated) and then apply the rotation onto the whole group at once.
P.S. Actually I see you’re already doing that with text — but apparently still use the trig pack to calculate x/y to draw the lines? You could just do the same with lines as you do with text.
P.P.S. Minor perfectionist’s peeve: for labels you’re using the baseline as the pivot coordinate, hence they look a bit off. So you may want to pre-translate them a bit so that the “line” goes through the optical middle of the text:
In my case, the radar chart, I couldn’t avoid calculating the sines/cosines myself because I had to draw polygons. If I had to do this for a large number of data points, I’d probably pre-load my Coda doc with a sine lookup table, e.g. pre-calculate all angles between 0 and 90 with a step of 0.5 degrees, and then simply linearly interpolate. It wouldn’t be extra accurate but it would be good enough for visualization.
2 Likes
Hi @Paul_Danyliuk ! Thanks a lot for comment.
Ahah this advice shows in a millisecond my lack of knowledge about svg code, that I absolutely did not know 10 days ago…  I was stuck in some “mathematic” point of view with polar coordinates, and forget to use the whole transformation system of svg directly. I’m correcting it now and indeed it’s waaaaaaay better
Yes, still improvement to do for better perfection looking !
2 Likes
Updated the embed doc according to @Paul_Danyliuk recommandation !
And then we reach the speed of light about chart update <3 !!!

And allows me to display way more data !
3 Likes


