I have a pretty simple problem for which there doesn’t seem to be a simple solution.
In this example, I have an automated action that runs once per day. It takes the current, calculated value of a savings portfolio, then adds a new row to the snapshots table.
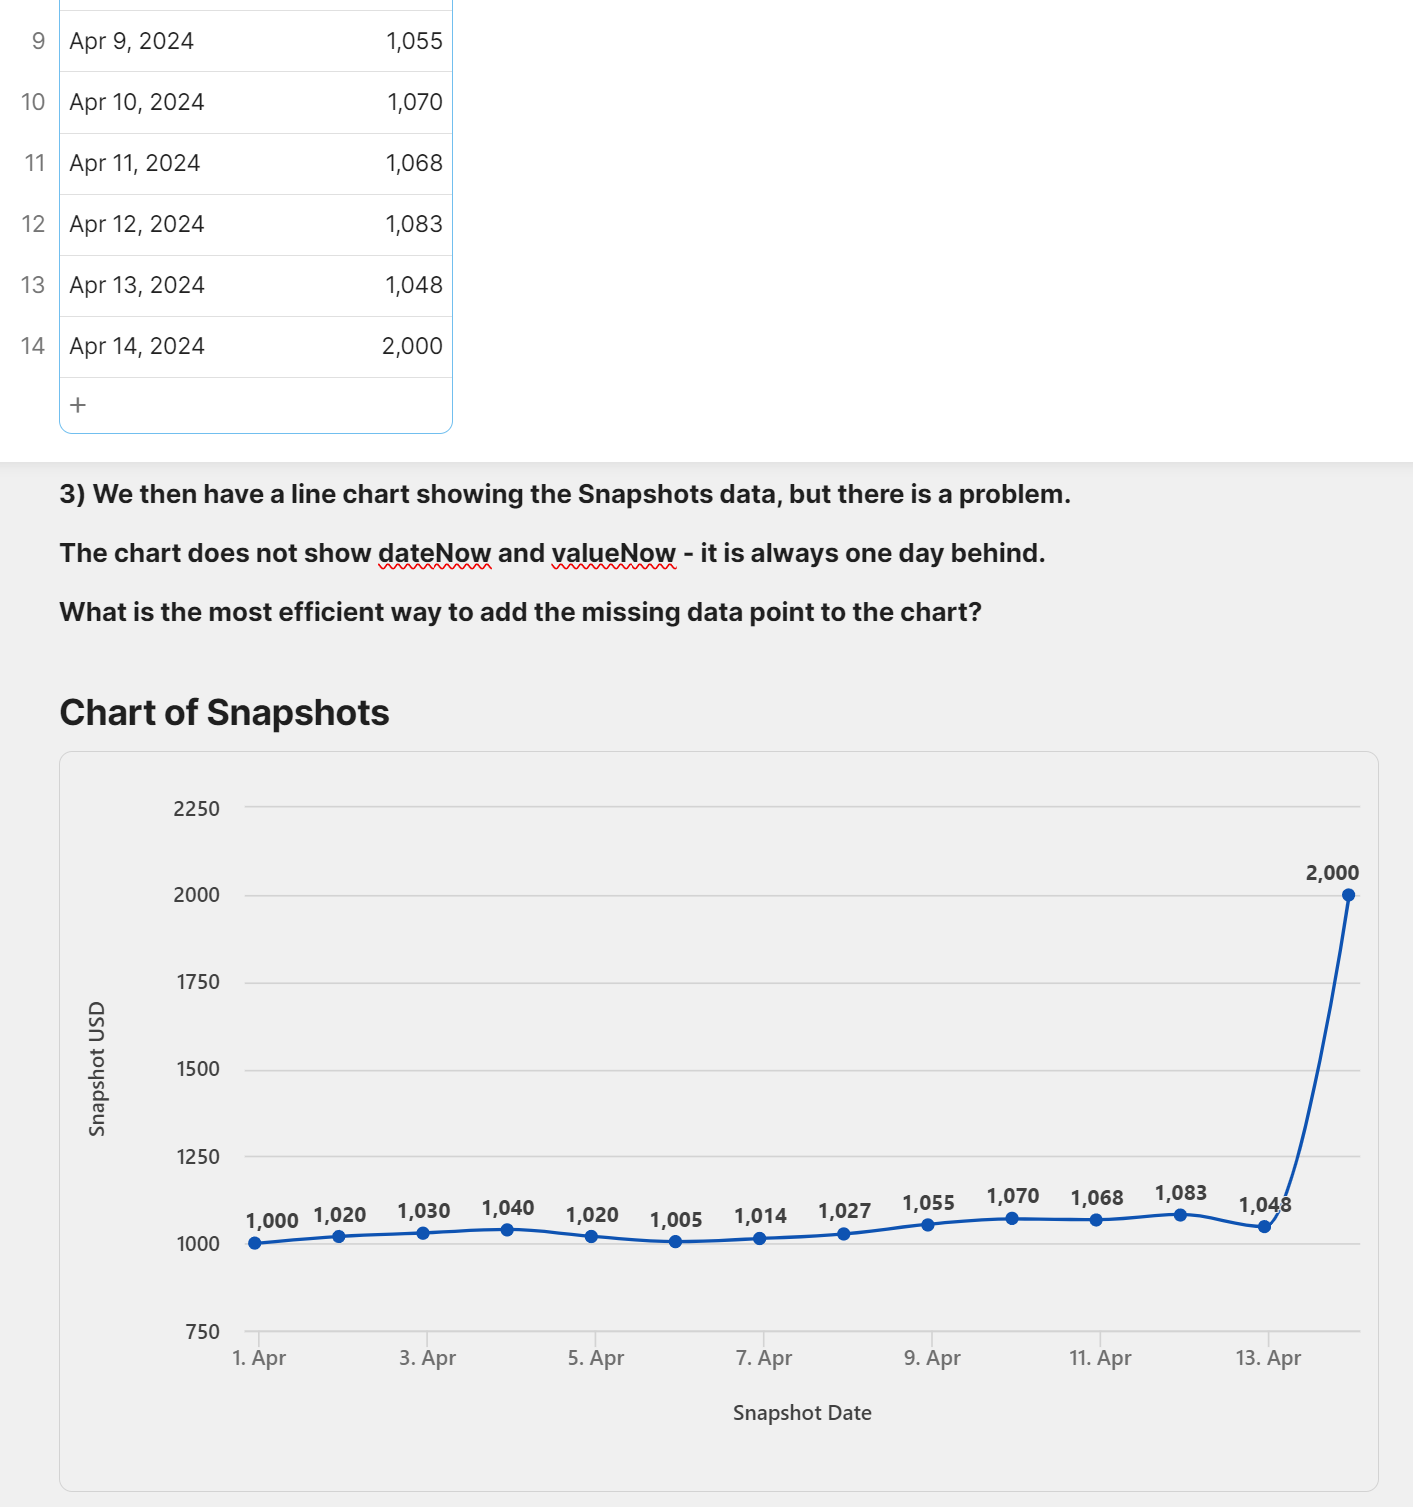
I then have a line chart that is set to display the data from the Snapshot table:
As you can see, my line chart can not display the current portfolio value (14th April). It can only display data up until the last snapshot taken, which was yesterday (13th).
The only way I can think to add this value to the line chart is with a hidden column and a switch statement. The table would have one empty row at the end, and the switch statement in a hidden column would either copy the value from the USD column, or get the calculated value if the row is empty
In this simplified example, that would probably be fine. However in my experience, switch statements are not ideal for performance. In the real scenario I have thousands of rows and multiple currencies. It is also a pain coming up with descriptive names for hidden columns that basically just duplicate data. Something about it feels “wrong”.
I would like to know if there is a better way, or whether this approach is indeed the correct one.
In these situations you better add a sample doc everybody with a link has access to. That said it seems you want to have in your snapshot table everyday a row with the value of today, even if there is no data yet.
I see two options:
when you bring in the data per currency, you add the date + rate and the date + 1 with no value
every night you have an automation running adding the date of today
I had a look in the table and noticed only yesterday as max date, the date of today did not live in that table. When I add ‘today’ it works (value 2,000). I guess we are not on the same page here, can you tell me a bit more of what it is I do not see?
The live price is dynamic, what you did was just manual input i.e hardcoded the data. This is what the automation does at the end of each day, i.e it takes a “snapshot” of the live price for that day.
I want to always have the live price appended to the end of the dataset. Which can’t be done easily, because I can’t place a formula only in the last row of the table. A formula would need to be applied to every row
In any case I have solved problem with hidden columns. I was just hoping that wouldn’t be necessary
the table had only rows until April 13, indeed I added april 14. when the API does that adding, it will show.
when an API or an automation adds a row, you can use the option ‘value for new rows’ and via this way (also via a formula) define how that value should look like. Maybe this is what you have been looking for.
The proper way to go about it would be to have the second, calculated column that would show the snapshotted value for past days and the ongoing value for today. Then you make a chart on that calculated column
The formula can be something like:
If(
  Name = [Current Date],
  [Current Day Value],
  [Stamped value]
)
or if you can guarantee there won’t be extra days in the future, something simple like this will also work:
[Stamped value].IfBlank([Current Day Value])
Here’s the sample
For completion sake, I’m fairly sure it’s possible to achieve the formula in an editable cell by inserting a canvas there but that’s perhaps too advanced.