Suggestion: Charts should support cells that contain multiple values. Use case: The column represents a question on a survey, quiz, or poll, and the values represent a multi-select answer.
Example: Which of these product mockups do you like? (with 4 choices)
Example: Product Colors (red, blue, green, yellow, brown, black, gray/silver, white, orange) – where a product can have multiple colors
Example: What factors are important to you when choosing a place to live?
I think that your suggestion make sense in some cases!
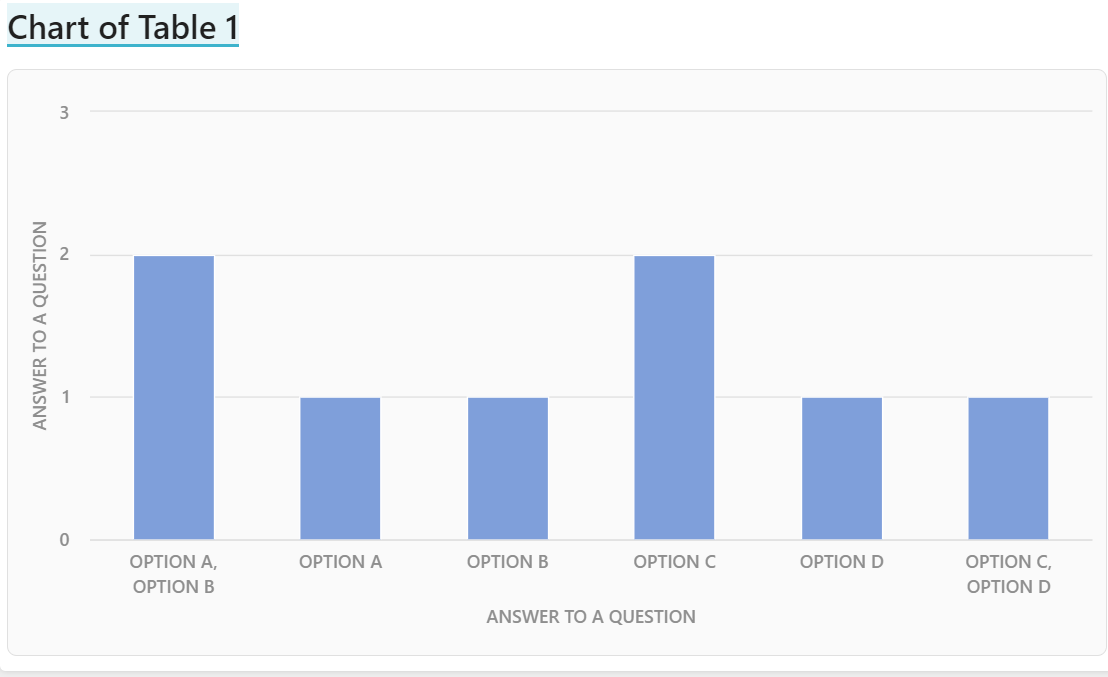
In the meantime if you need you can apply a small “hack” and, converting to a table your select list, and adding a new column that count how many times the row is selected in that table, you can obtain what you want!
If you want you can share the doc and i can show you how i would set this up
Hi, would it possible for you to write a short description how you made this. Just by looking quickly there seem to be som kind of connection (views?) between the tables. I’m just trying out Coda and might solve so big problems I have with just this. Thanks in advance!