Custom Pack Pattern: Table Data Analysis

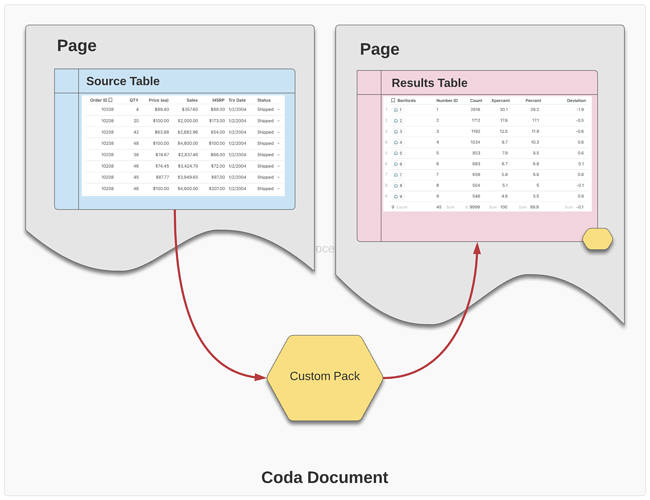
As I continue to learn more about building custom packs, a specific pattern has emerged a few times. The custom pack is design to read a table, perform various analytics and other processing, and then write a completely new results table. Like this…

This is similar to creating a new view of the data, but the resulting schema is quite different. Depending on the objectives of the view, the results schema is likely very different from the source data it processes. A good example is a Benford’s Law analysis to detect if any of the data is fabricated.

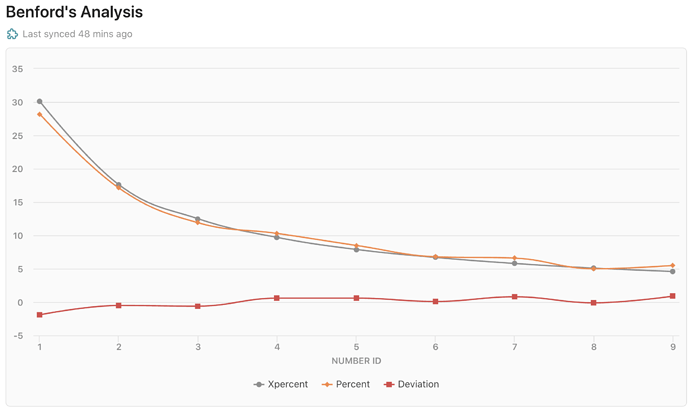
A custom pack to do this must read a given column (or a collection of columns) and produce a chart showing how the actual data compared to Benford’s predicted model of the data. The Xpercent (gray) curve is Benford’s model - the predicted percentages of numbers beginning with a specific number 1 through 9. The Percent (orange) curve is the actual data. In a data set that has not been “cooked”, the curves should be roughly equal. Large deviations (red curve) indicate the numbers in the column analyzed are probably fabricated - i.e., not naturally occurring.

The beauty of baking this into a pack is the effortless use of Benford’s law to detect fraud in data. In just a few seconds, you can install and configure this pack.

The Pack Pattern

The pattern used for this is pretty straight-forward once you’ve created it a half-dozen times. :wink: Soon I’ll publish a simplified version of the pattern that could be easily applied to other objectives.

It requires a single parameter; an array representing the number values to be analyzed; in this case a column of insurance policy values. This could be any column of numbers and the pack could also support number values stored as strings but that would require a slight modification to the pack itself.

//
// define the parameters
//
const numberArray = coda.makeParameter({
  type: coda.ParameterType.NumberArray,
  name: 'Numbers',
  description: 'the numbers you want to calculate',
});

The schema that this pack exports is very simple.

//
// Benford's schema
//
const BenfordsSchema = coda.makeObjectSchema({
  type: coda.ValueType.Object,
  id: "numberID",
  primary: "numberID",
  properties: {
    numberID  : {type: coda.ValueType.String},
    count     : {type: coda.ValueType.Number},
    xpercent  : {type: coda.ValueType.Number},
    percent   : {type: coda.ValueType.Number},
    deviation : {type: coda.ValueType.Number},
  }
});

The processing is a little more complex, but this gives you some insight into the Benford model.

    //
    // process the data 
    //
    execute: async function ([numberArray], context) {

      //
      // summarize the rows into the numberic counts
      //
      let benfordCounts = {};
      let aXPercent = [0.0,30.1,17.6,12.5,9.7,7.9,6.7,5.8,5.1,4.6];
      for (var i = 0; i < numberArray.length; i++)
      {
        var thisDigit = numberArray[i].toString()[0];
        if (thisDigit != "0") {
          benfordCounts[thisDigit] = (benfordCounts[thisDigit]) ? 
            {
              "numberID" : thisDigit,
              "count" : benfordCounts[thisDigit].count + 1,
              "xpercent" : aXPercent[thisDigit],
              "percent" : 0.0,
              "deviation" : 0.0
            } :
            {
              "numberID" : thisDigit,
              "count" : 1,
              "xpercent" : aXPercent[thisDigit],
              "percent" : 0.0,
              "deviation" : 0.0
            };
        }
      }

      //
      // compute the percentages
      //
      for (var j in benfordCounts)
      {
        benfordCounts[j].percent   = Number((benfordCounts[j].count / numberArray.length) * 100).toFixed(1);
        benfordCounts[j].deviation = Number(benfordCounts[j].percent - benfordCounts[j].xpercent).toFixed(1);
      }

      //
      // transform the data frame to match the schema
      //
      const aResults : string[] = [];
      for (var j in benfordCounts)
      {
        aResults.push(benfordCounts[j]);
      }

      console.log(aResults);

      return {
        result: aResults,
        continuation: undefined,
      };
    
    },
10 Likes

Amazing @Bill_French , you just prove how flexible Coda is compared to other tools. Coda can even replace my BI notebook.

1 Like

this is so good @Bill_French , please post more of this kind of material and insights! Many thx!, Christiaan

2 Likes

Whenever a platform is graced by an open scripting environment, the floodgates of innovation are typically opened. The sky is not the limit and there are some limitations with Packs Studio, but not many. The extensibility is there - now it’s up to the community to determine what the future looks like.

3 Likes

I thought Airtable had the potential after scripting was opened to the public. It had a great start but it became very lackluster. I’m not sure why.

Well, if you can classify an $8.7B valuation as “lackluster”, you must be heavily invested in Tesla. :wink:

Yes - Airtable launched a number of integrated scripting environments - three to be precise - and each has its place. One reason the uptake of scripting by the development community was sluggish is the always-lurking idea that they would eventually charge more to customers who wanted to use scripts. This constrained the excitement for aftermarket developers and only enterprise accounts seemed to plow ahead with scripts. Consultants and customers viewed it as a tax on innovation.

Another factor - no prospect for a marketplace for integrations and innovative uses of their scripting environments. The ability for commerce to form around IP in Airtable extensions is near impossible because of its underlying architecture and deployment model.

Lastly, lack of support; the average support person at Airtable has zero javascript development experience; users simply cannot get good guidance concerning the development of extensions in a manner that would make them commercially viable.

Unlike Airtable, Coda recognizes the unique attributes of makers and users; Airtable not so much. This has a profound negative influence on everything from product design to developer partner support.

Despite this, I receive 20 calls per week to build script extensions for Airtable customers; vastly from those with enterprise accounts. In my view, it’s great start has ballooned into serious coding demand and partly because so many Airtable shortcomings exist.

The irony of the no-code poster child that needs three scripting environments to achieve the feature set most businesses want does not escape me.

3 Likes

Lackluster in terms of its community. Airtable was launched much earlier than monday.com but monday.com, thanks to its marketplace, is much vibrant and valued around $17b.

Well, the three reasons you pointed out are valid and I believe Coda will be valued more than Airtable within 3 years.

1 Like

Indeed, Airtable is decades-old by Internet standards, and they struggled with their tech at scale for many years. But despite Monday’s early success, the lifecycle arcs of the two companies will likely be very different. Neither company could be wholly regarded as a “platform” - both are decidedly no/low-code data-centric solutions. Coda seems to be using all the right words and architectures of a no/low-code platform which is more likely to create a success arc that is far longer and somewhat flatter.

In 2035 we will not likely be uttering names like Airtable or Monday, but I think we’ll be eagerly waiting for the next new release of Coda.

2 Likes

Thanks for this @Bill_French , please continue to share examples like this as you develop them. It’s helpful to see practical applications, and in particular the different ways that custom Packs might productively plug into docs.