As part of our project management system, I need to be able to calculate an amount using foreign exhange rates on a particular date.
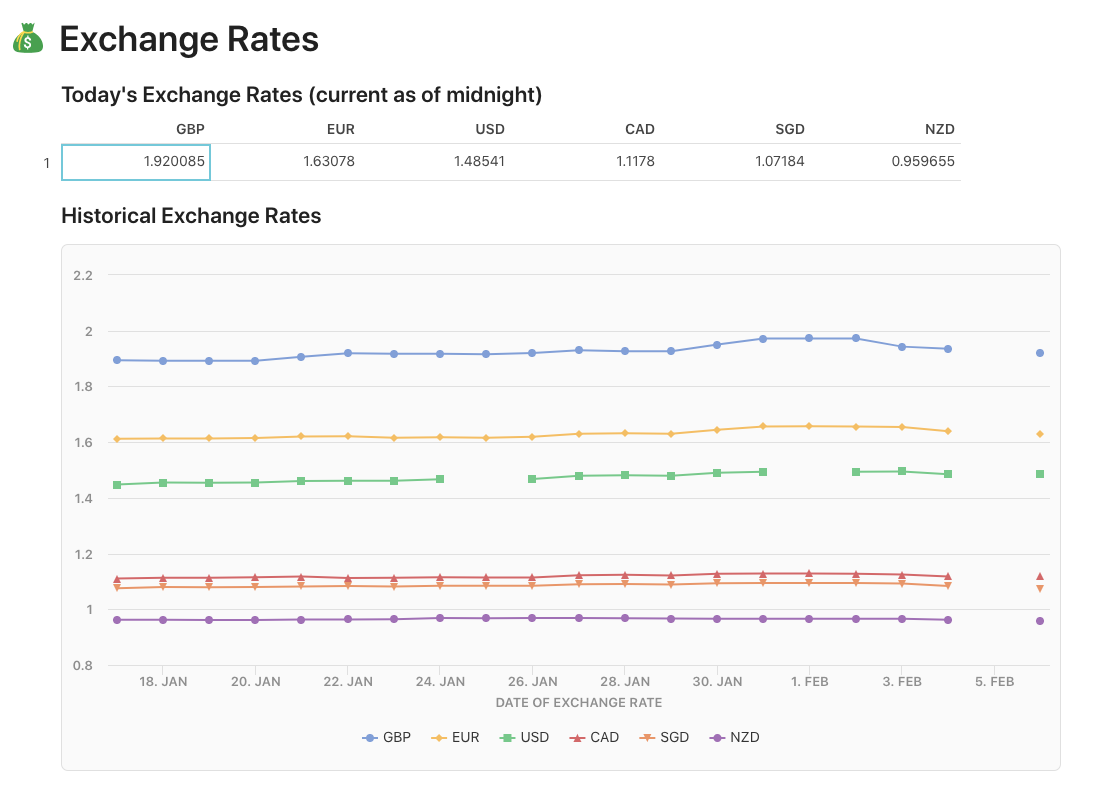
I’ve made a google sheet that pulls in the exchange rate data once a day, and I use zapier to send it over to a coda table. That gives me the rates needed. Win. (Its not perfect - you can see in the graph that there’s been interruptions to the data… USD for instance doesn’t give the data on the weekends, and something strange happened wednesday… but I can fix that!)
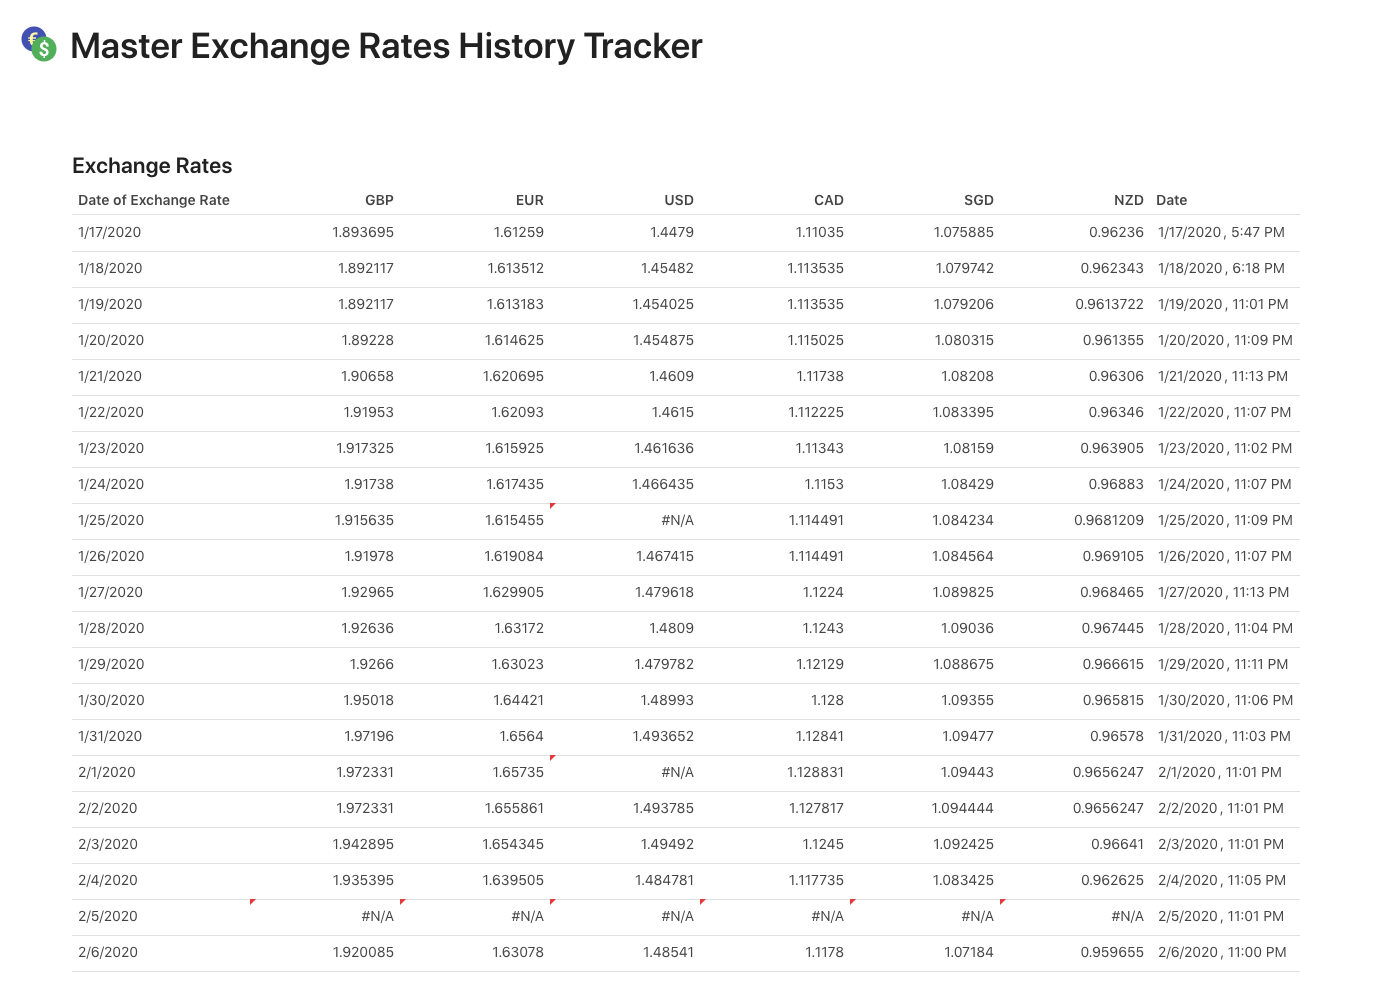
My question is what formula can I use to find an exchange rate that is specified in a row of a table.
Ie : my table has the date needed, and the exchange rate code (say, USD) as a lookup. However, I cannot for the life of me work out how to do it - without perhaps a massive nested if statement.
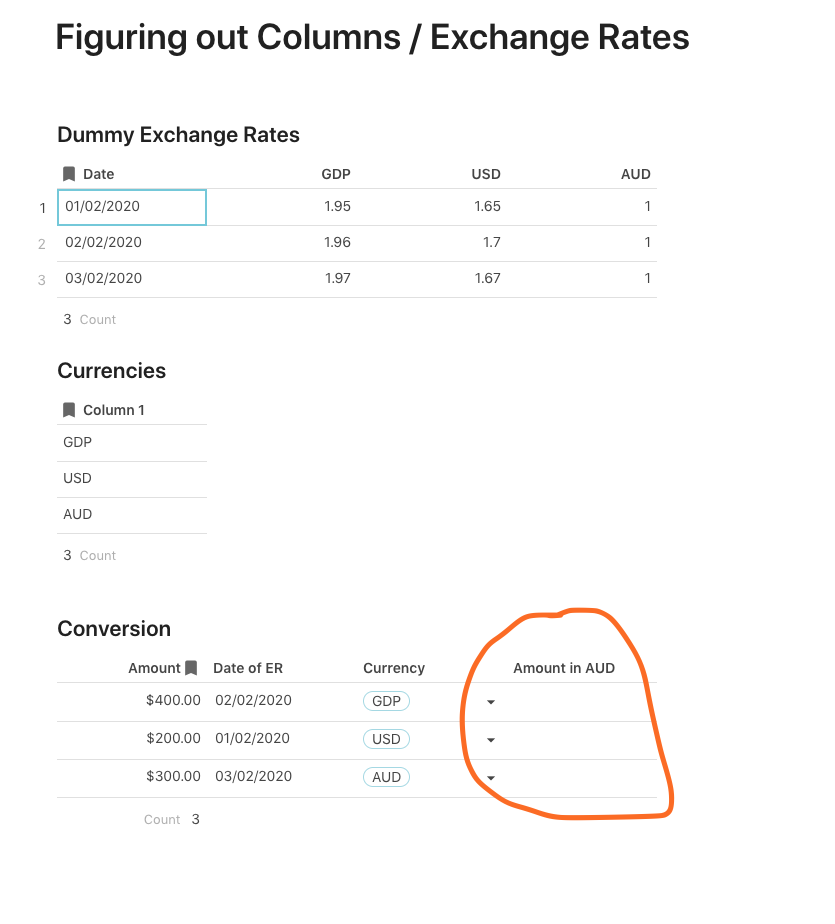
I’ve created a test document to show the basic table setup - and a column where I’d like the calculation.
I’m wondering if perhaps my overall data schema is not great for this?!
I’m essentially tring to use the currency lookup and the date to apply a VERY simple formula to the amount in the first column… and have it calculate in the circled column.
However, due to the setup of the exchange rate table, I’ve had LOADS of trouble figuring this one out. And I’m guessing its VERY easy???!!!
Until we get programmatic access to columns, you will likely want to use a SwitchIf() statement. (The red columns had data matching problems that I didn’t dig into further to understand.)
Hello @Brendan_Woithe
Unfortunately with the way you set up your Exchange Rates Table you will need to use a switch() formula as @Ander showed.
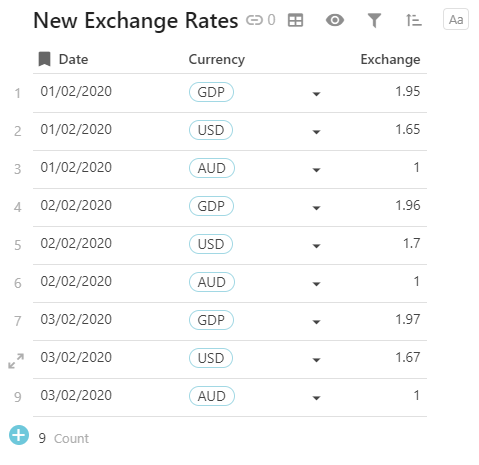
Though there is another way, you can change the Exchage Rates table so it has just 3 columns: Date, Currency, Exchange.
That way you would only have to make a filter of the currency and the date to get the exchange rate with the next formula:
[New Exchange Rates].Filter(Currency=thisRow.Currency and Date<=thisRow.[Date of ER]).Last().Exchange
With this you can get any currency you add without having to change the formula, contrary to the switch formula.
I discussed this with them a few days ago. They changed it for security reasons. The Share/Embed modal needs better signage to reflect this change, imho.
Thanks guys!
I had setup my exchange rate table the way you see it due to the way I need to setup my google sheet to automatically grab the data. (Ie, 1 row per day - I’ve made a little script to just add a row to the google sheet once every day)
I can def see that its possible to re-work it to grab the data using the new schema, although its a little more complex than the current method of just adding a new row to the document at a certain time every day, and then 5 mins later sending that same data straight to coda using zapier. It also might interfere with some of the ideas I’ve had to clean up the data when the google finance formula fails (as it does once per week like clockwork with the USD rates on sundays!)
Appreciate the help. I’m going to have a fiddle and will report back. Cheers!
@Saul_Garcia and others - just chiming in again to say a big thanks for this… and to let you know what I’ve done.
I realised pretty quickly that formatting my table as suggested would also break graphs I had created… so instead of trying to redo everything, I wondered if I might be able to solve the issue by running two tables for the exchange rates.
The first is the one I have - and it grabs the data from the google sheet.
The second is using the schema suggested. And it is created using automations based on looking at when the first table has a row changed. Its like automations were built for this use case. No stress on the timing (which is frustratingly slow for other applications) and extremely easy to setup.
I went down this path when I realised that building a lookup talbe with the new scheme probably wouldn’t be viable!
Anyway - seems to be working - at least in my small test just now. I’ll build it out and hopefully in a bit update the entire app to use this table going forward.
 opener


