First question is, how do I count the number of checkboxes in total and then how do I count the number of checkboxes that have been checked?
This leads to the second question.
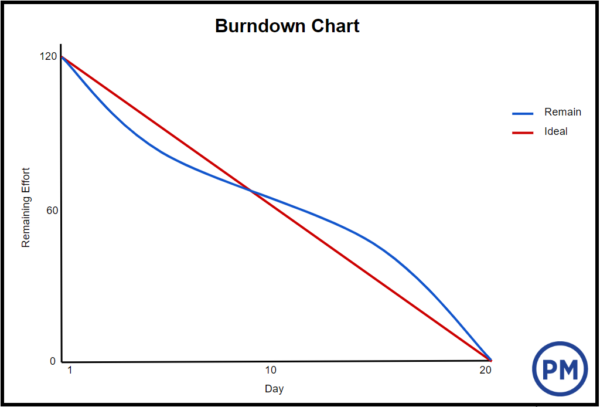
I want to show a burndown chart that displays where they are in the progression of checking off the checkbox items as the month progresses, and how that relates to the trend line. Something like this:
The red line would be the trend line, and I would like to update the burndown every day to indicate how many checkboxes are left to be completed and how that relates to the trend line.
In Chart Day, how do you calculate the Target column. It seems that this should be the total number of checkboxes broken out across the month. Is there a formula you can use to calculate this for the the full table to break down the daily target equally across the month?
Is there a way to convert the day number at the bottom of the chart to a date within a date range. For example, if I expand this to 90 days, and I specify in the doc that Month 1 is ‘April’ and Month 3 is ‘June’, can I display that day 35 would be 5th May?
Finally, is there a way to flip the chart so the trend line goes from the top left down to the bottom right?