I am a total newbie, recent Notion convert. I am completely blown away by Coda itself, as well as the amazing community around the application.
I’m trying to create a template for researching investments and want to be able to calculate the growth rate for certain items over one, five and ten years. The one year value was easy but I’m having trouble figuring out a formula to make this happen for the five and ten year values.
I’ve searched the forums and Reddit with no luck, could any of you offer insight?
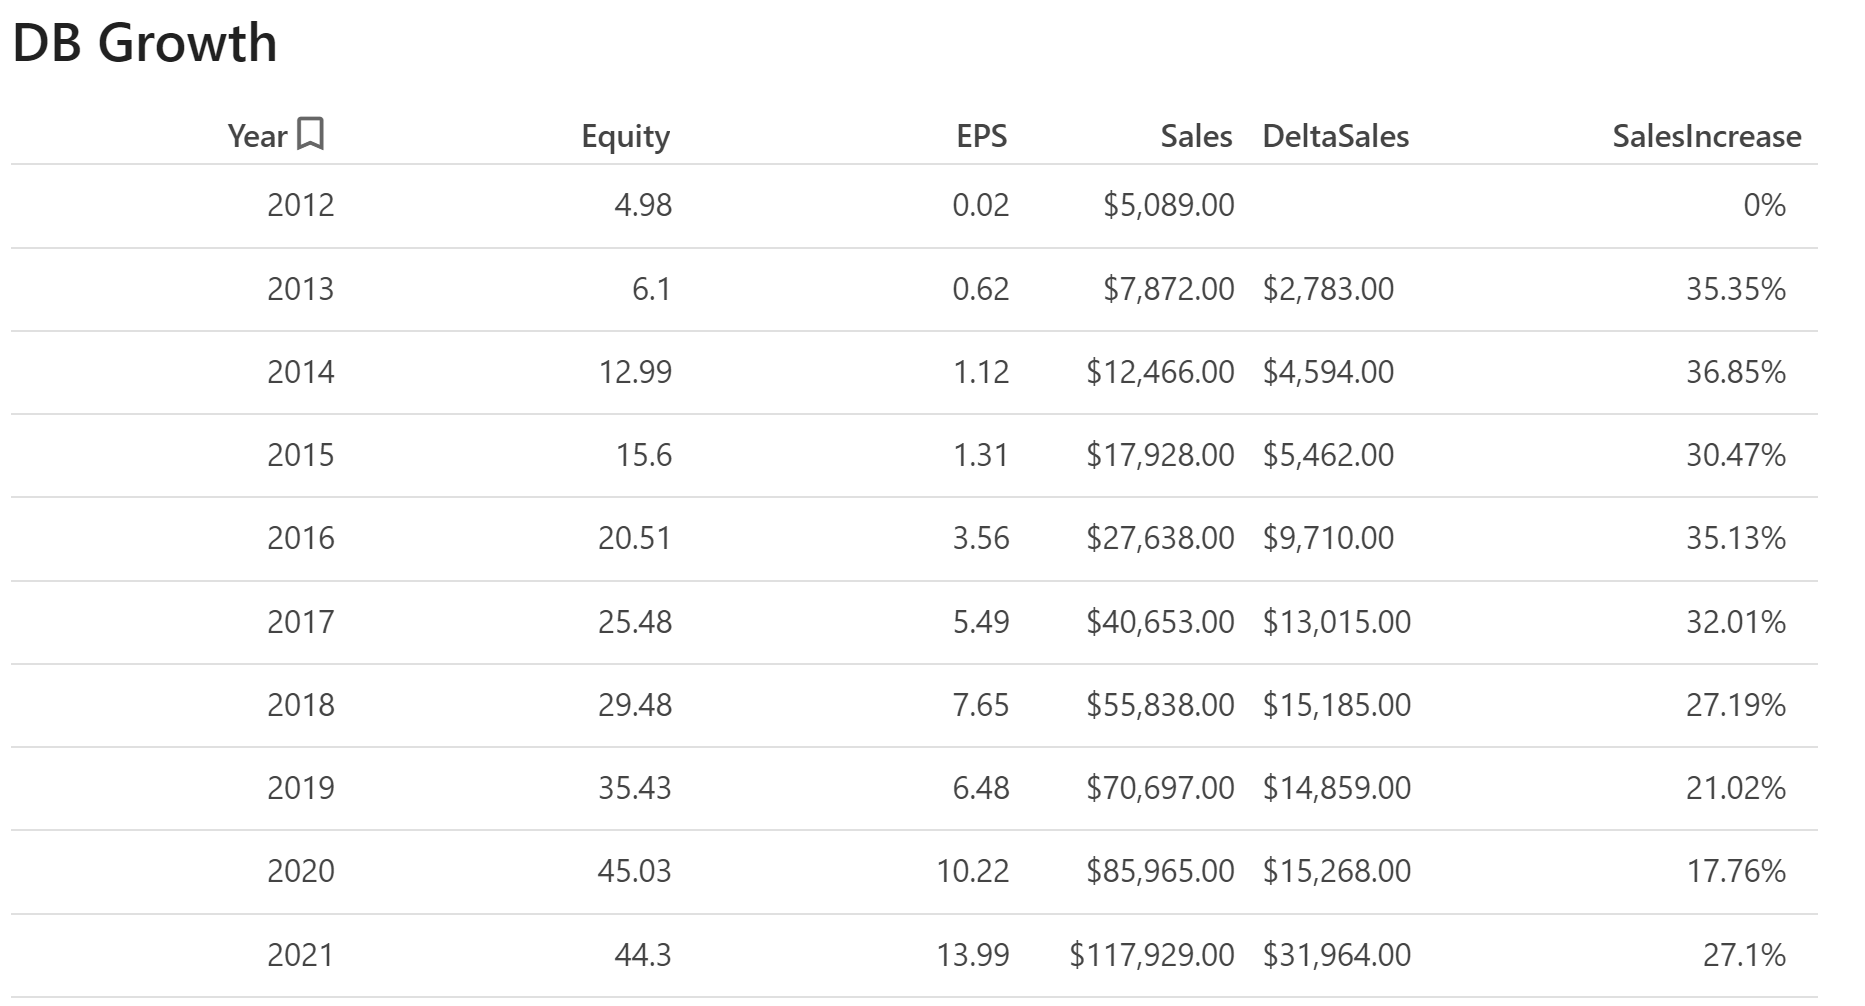
Here’s a screenshot of how the data is arranged. If this is not adequate, I would be happy to create a dummy doc and share it. It’s pretty straightforward though.
I have created it in a way that I can just copy and paste the data from a financial website.
I want to find the 5 year and the 10 year growth rate of the sales, equity, EPS and free cash flow.
Also, Coda - as well as other relational oriented data tools - favorites a row-based approach rather that a column-oriented.
Meaning that it is usually easier add a row than a column and if you follow this principle you’ll take full advantage of the tool (also provided in the sample).
This means that we can reorder the data you provided as below and also get the delta values applying the logic you see :
Thank you so much for taking the time to formulate this reply Christiaan!
There is so much to learn about how formulas work in Coda and you have given me a lot of good information here. Unfortunately, it doesn’t appear to provide the answer that I am looking for.
The purpose of the doc that I am creating is to evaluate potential investment opportunities. The data that I am inserting is gathered from a financial website and simply pasted into Coda, so I don’t need to calculate the growth from year to year, just the percentage of growth over specific periods of time.
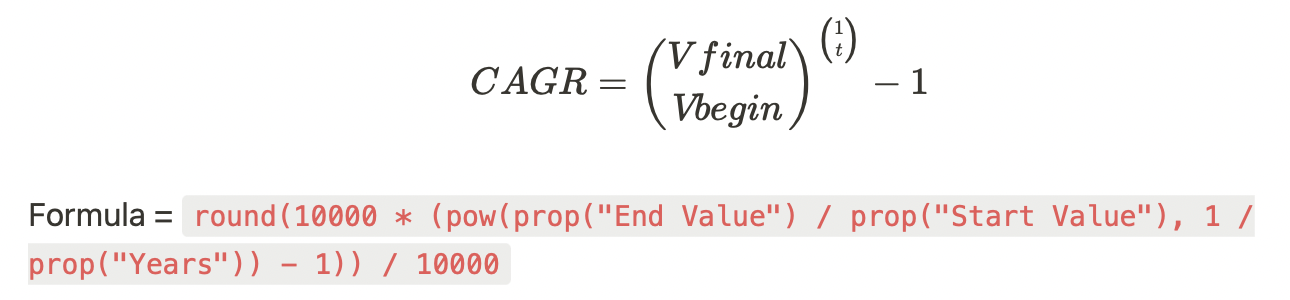
The value that I am after is the Compounded Annual Growth Rate (CAGR).
The formula in Excel is:
EB/BB^(1/n)-1
This is what it looks like in Notion, if that is helpful in any way:
Quick followup question for @Agile_Dynamics or anyone else that might be able to advise.
This formula works perfectly for making the calculation but there is still something that is not quite right. I have created this as a template to be used when evaluating investments.
I have added a simple Conditional Format to turn the cell green when the result is above 10% and red when it is below 10%. This works just fine on the 1 year column, which is a much simpler formula, but does not work on the 5 year and 10 year columns.
When the data cells are empty, this is what the formula cells look like.
Also, when I look at the formula for the 5 year and 10 year average once the template has been inserted into a page and data added to the table, I get the following error message.
The “wrong argument type” message is to my opinion because the columns 2021 and 2017 are with the property “text” and accordingly to formula for Power() it expecting a Number property for the columns 2021 & 2017.
Could you clarify the formula used for 1 year conditional formatting, or even a dummy doc without sensitive data to give a helping and to the one picking up on your request?