I am stuck trying to create this type of chart (sketch below)
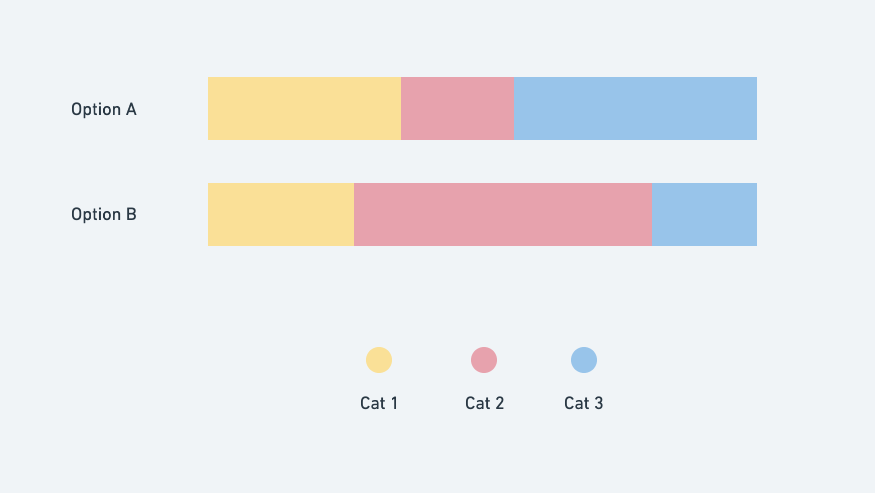
From a table like so:
Can someone help?
Thanks!
I am stuck trying to create this type of chart (sketch below)
From a table like so:
Can someone help?
Thanks!
Hi @Robin_Bigio,
Please, have a look at this implementation:
Basically, you’d need to swap rows and columns to get exactly what you need (solution 1)
However, I’d switch to a more flexible solution (solution 2)
I don’t know if it’s your case, but you might have more options and more categories.
Instead of “blocking” one of the two dimensions in the column list, I have moved to a row-based approach.
This way you can easily add Categories and options and the chart will reflect it automatically.
Please, let me know if this helps.
Cheers!
@Federico_Stefanato — this is really helpful.
From what I understand the grouped version is just another view of the original, but with columns grouped? I can’t really see the options for that table in View Only.
This is a screenshot of the actual table I am trying to do chart—I can’t easily swap columns and rows.
Thanks for the help!
Hi @Robin_Bigio
You can copy the document and edit as you like (ellipsis “…” on top left, right to doc name).
I understand.
I don’t know how much you can change your data model, but in order to have this chart (and to have a consistent relational perspective), what you could do is to decouple the Avg/Week columns and create a table Average By Category with the following columns:
Event Category (lookup on the current one)Avg/Week (with options list: New and Current)Value (the effective average number)At that point you plot the chart of Average By Category table.
Let me know if it’s not clear.
If you can share me a working sample I can show you in a doc.
Thanks @Federico_Stefanato! Here is a copy of that doc:
Hi @Robin_Bigio ,
perhaps in your case it’s better to walk around the problem.
Have a look:
Basically, you build up a specific structure only for the chart purposes.
The drawback, is that you have to explicitly trigger the button (either manually or through an automation)
Would this be a viable solution for you?
Let me know.
Cheers
