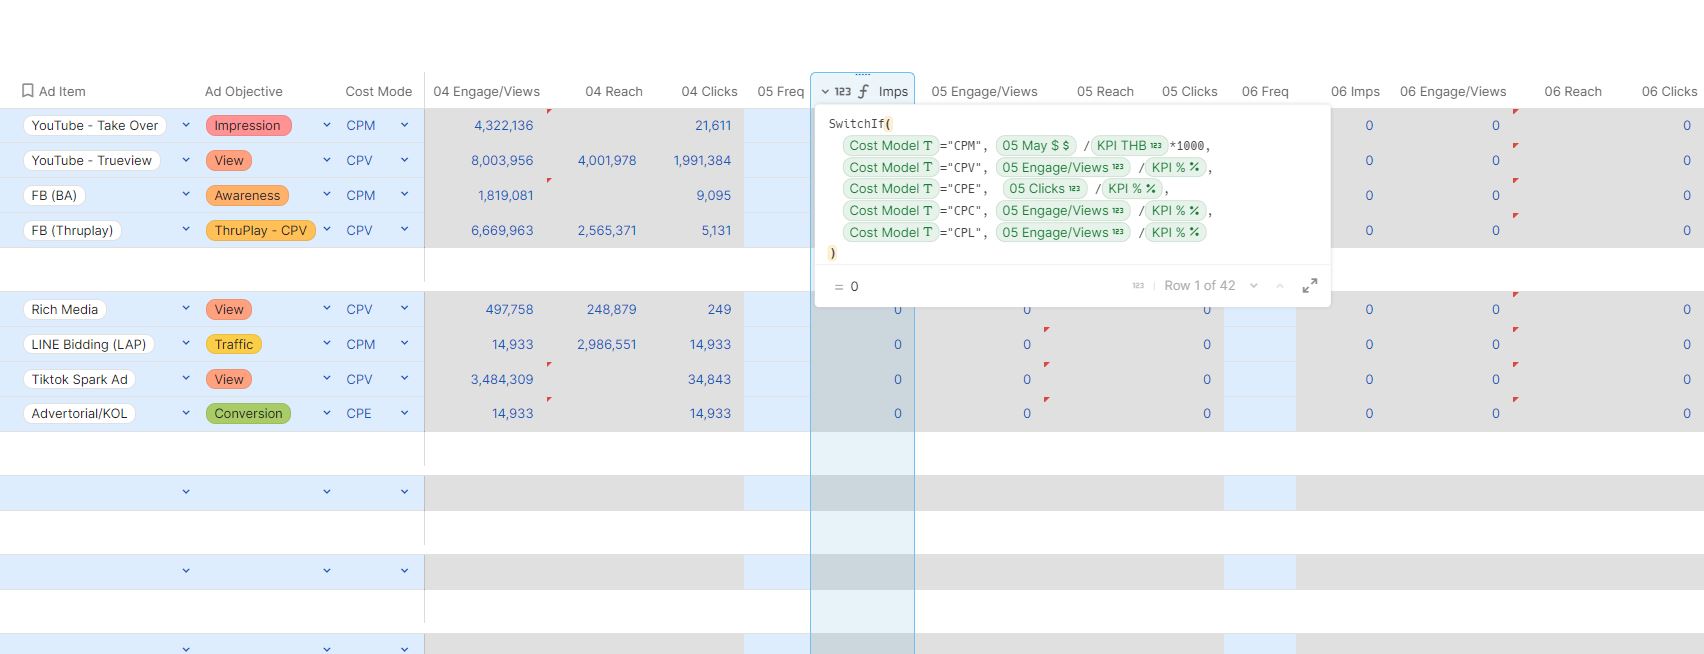
I’ve got a social media doc which uses a budget to estimate the amount of impressions, clicks, reach etc per month. So for my columns, I’ve got [01 Jan Imps], [01 Jan Reach] etc… There are 5 of these for every month, so 60 altogether (excluding the other columns). And I have to change each of these manually whenever I adjust formulas even a little bit. Is there a way to do this more elegantly?
Hi @yscias ![]() !
!
I’m not really in front of my keyboard but why not the other way around ?
Months as rows (potentially from a “Months” table (which should be easier if you need a summary by month)), Impressions, Clicks, reach … as columns ?
Your table would be longer as you would probably need multiple rows for 1 item … but it might make things easier …
(This is just a thought ![]() )
)
I’ve tried that, but had 2 problems.
-
When grouping the months above, the doc lagged so badly it was unusable, much more than when it had 80+ columns. Eventhough its using the same formulas… and technically should be faster… no idea why.
-
I couldnt add a column at the end that sums up all the previous months or columns.
If anyone has any ideas, it would be greatly appreciated!
This topic was automatically closed 90 days after the last reply. New replies are no longer allowed.