Timeline feature referenced here: Launched: New features to make your project trackers pop
Thank you!
Timeline feature referenced here: Launched: New features to make your project trackers pop
Thank you!
Hi @Kevin_Raheja and Welcome to the Community ![]() !
!
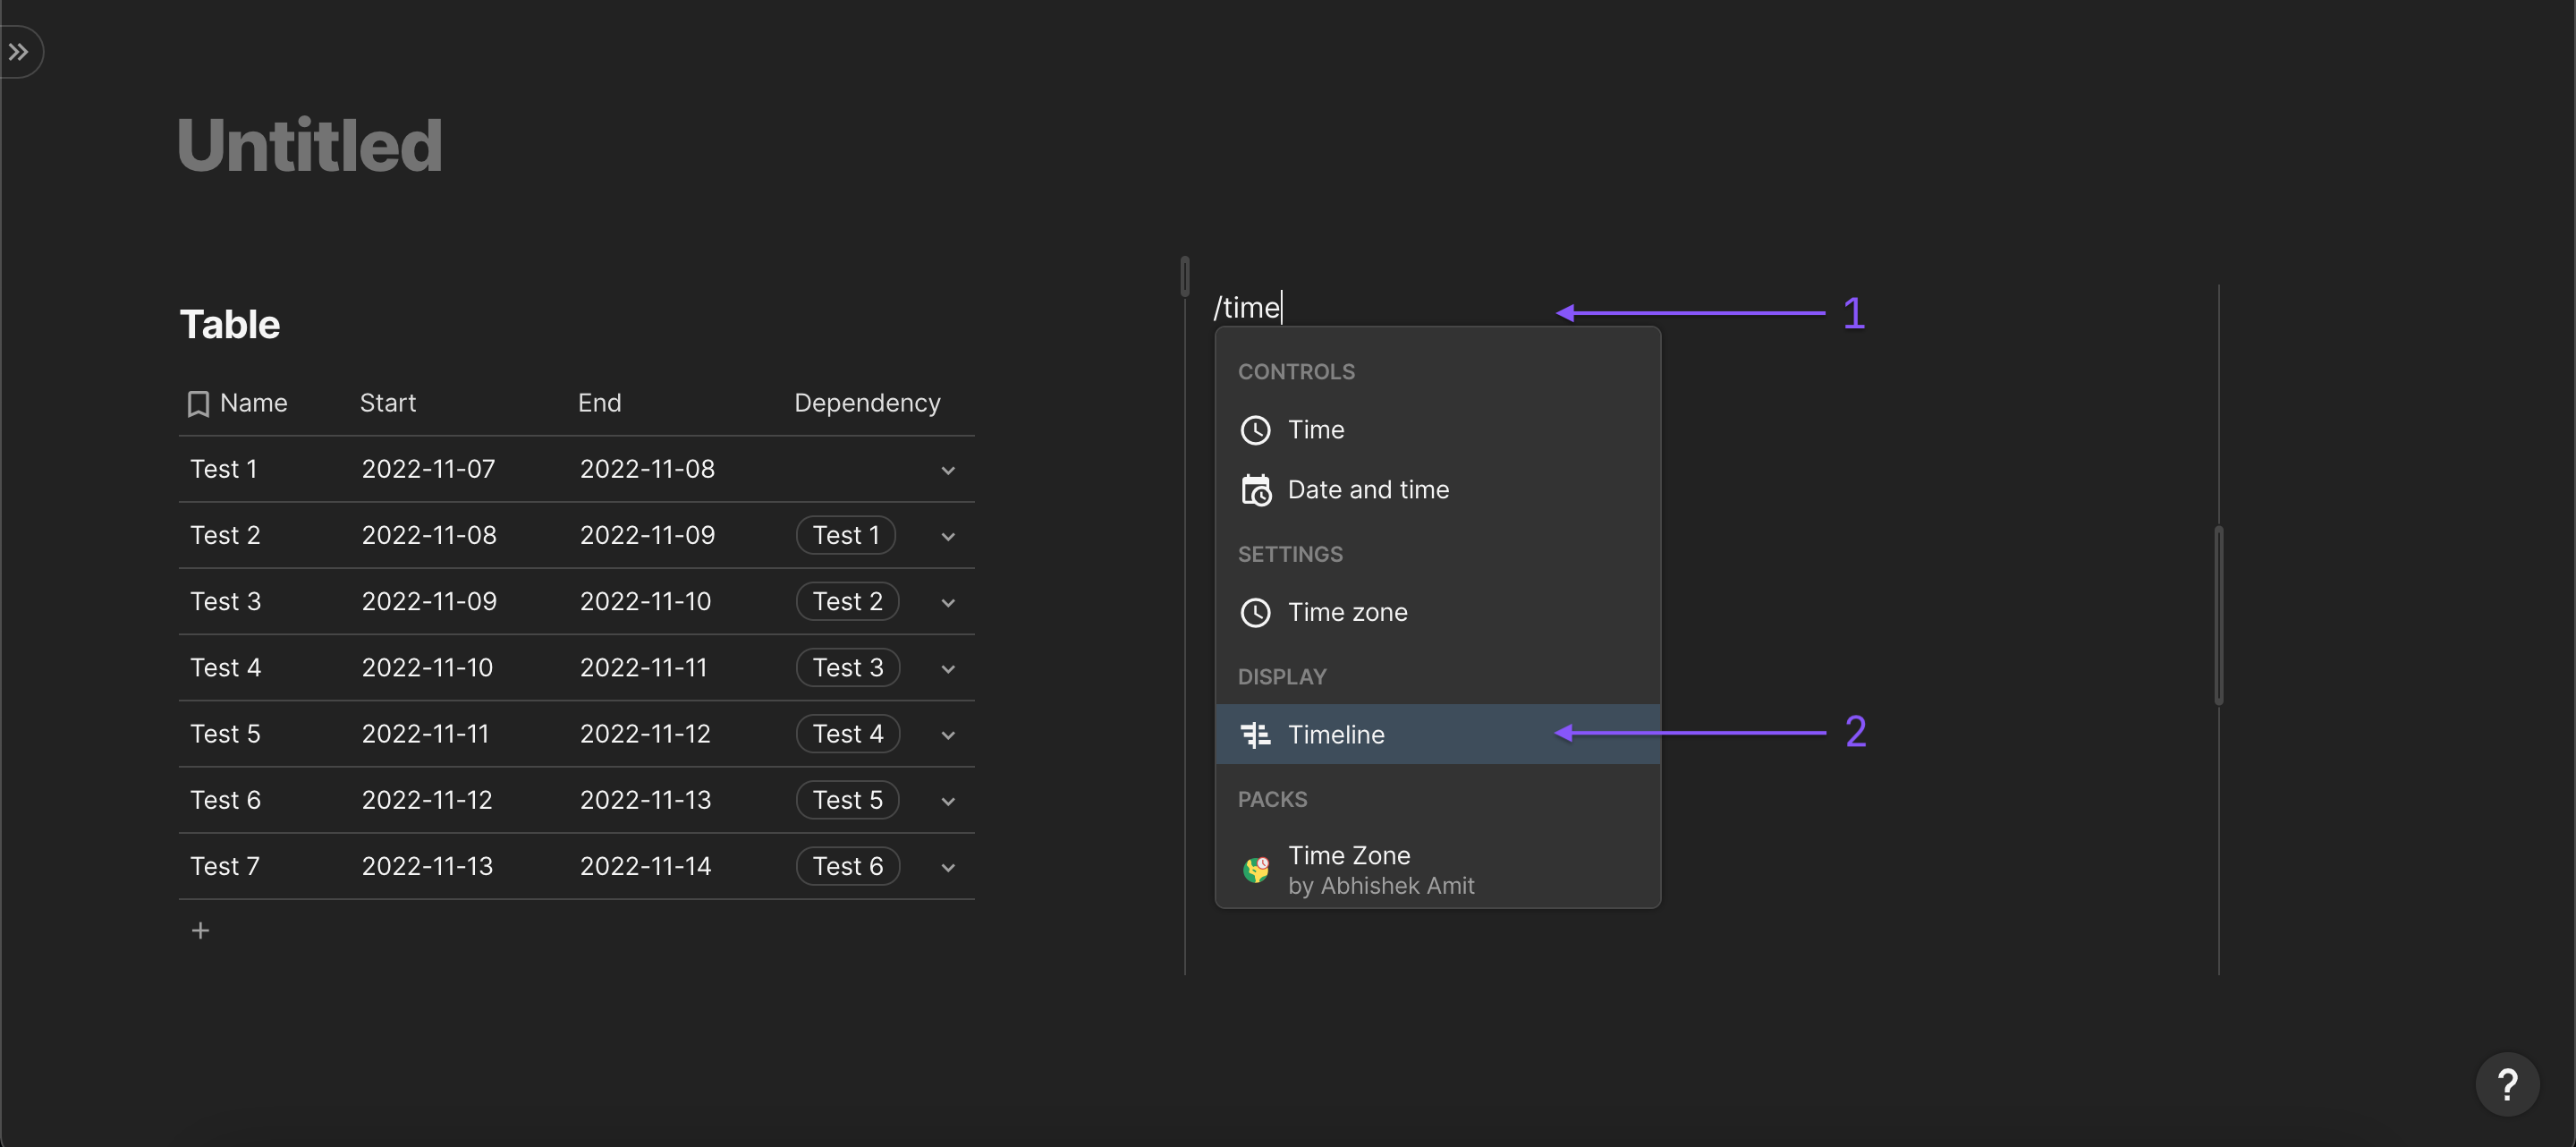
To create a Timeline/Gantt Chart, you can either use the /Slash Command menu by typing something like /time on the canvas where you wish to see your Timeline/Gantt Chart appear and select Timeline in the menu …
Coda will suggest you to either create a connected view of an existing table or a brand new table ![]()
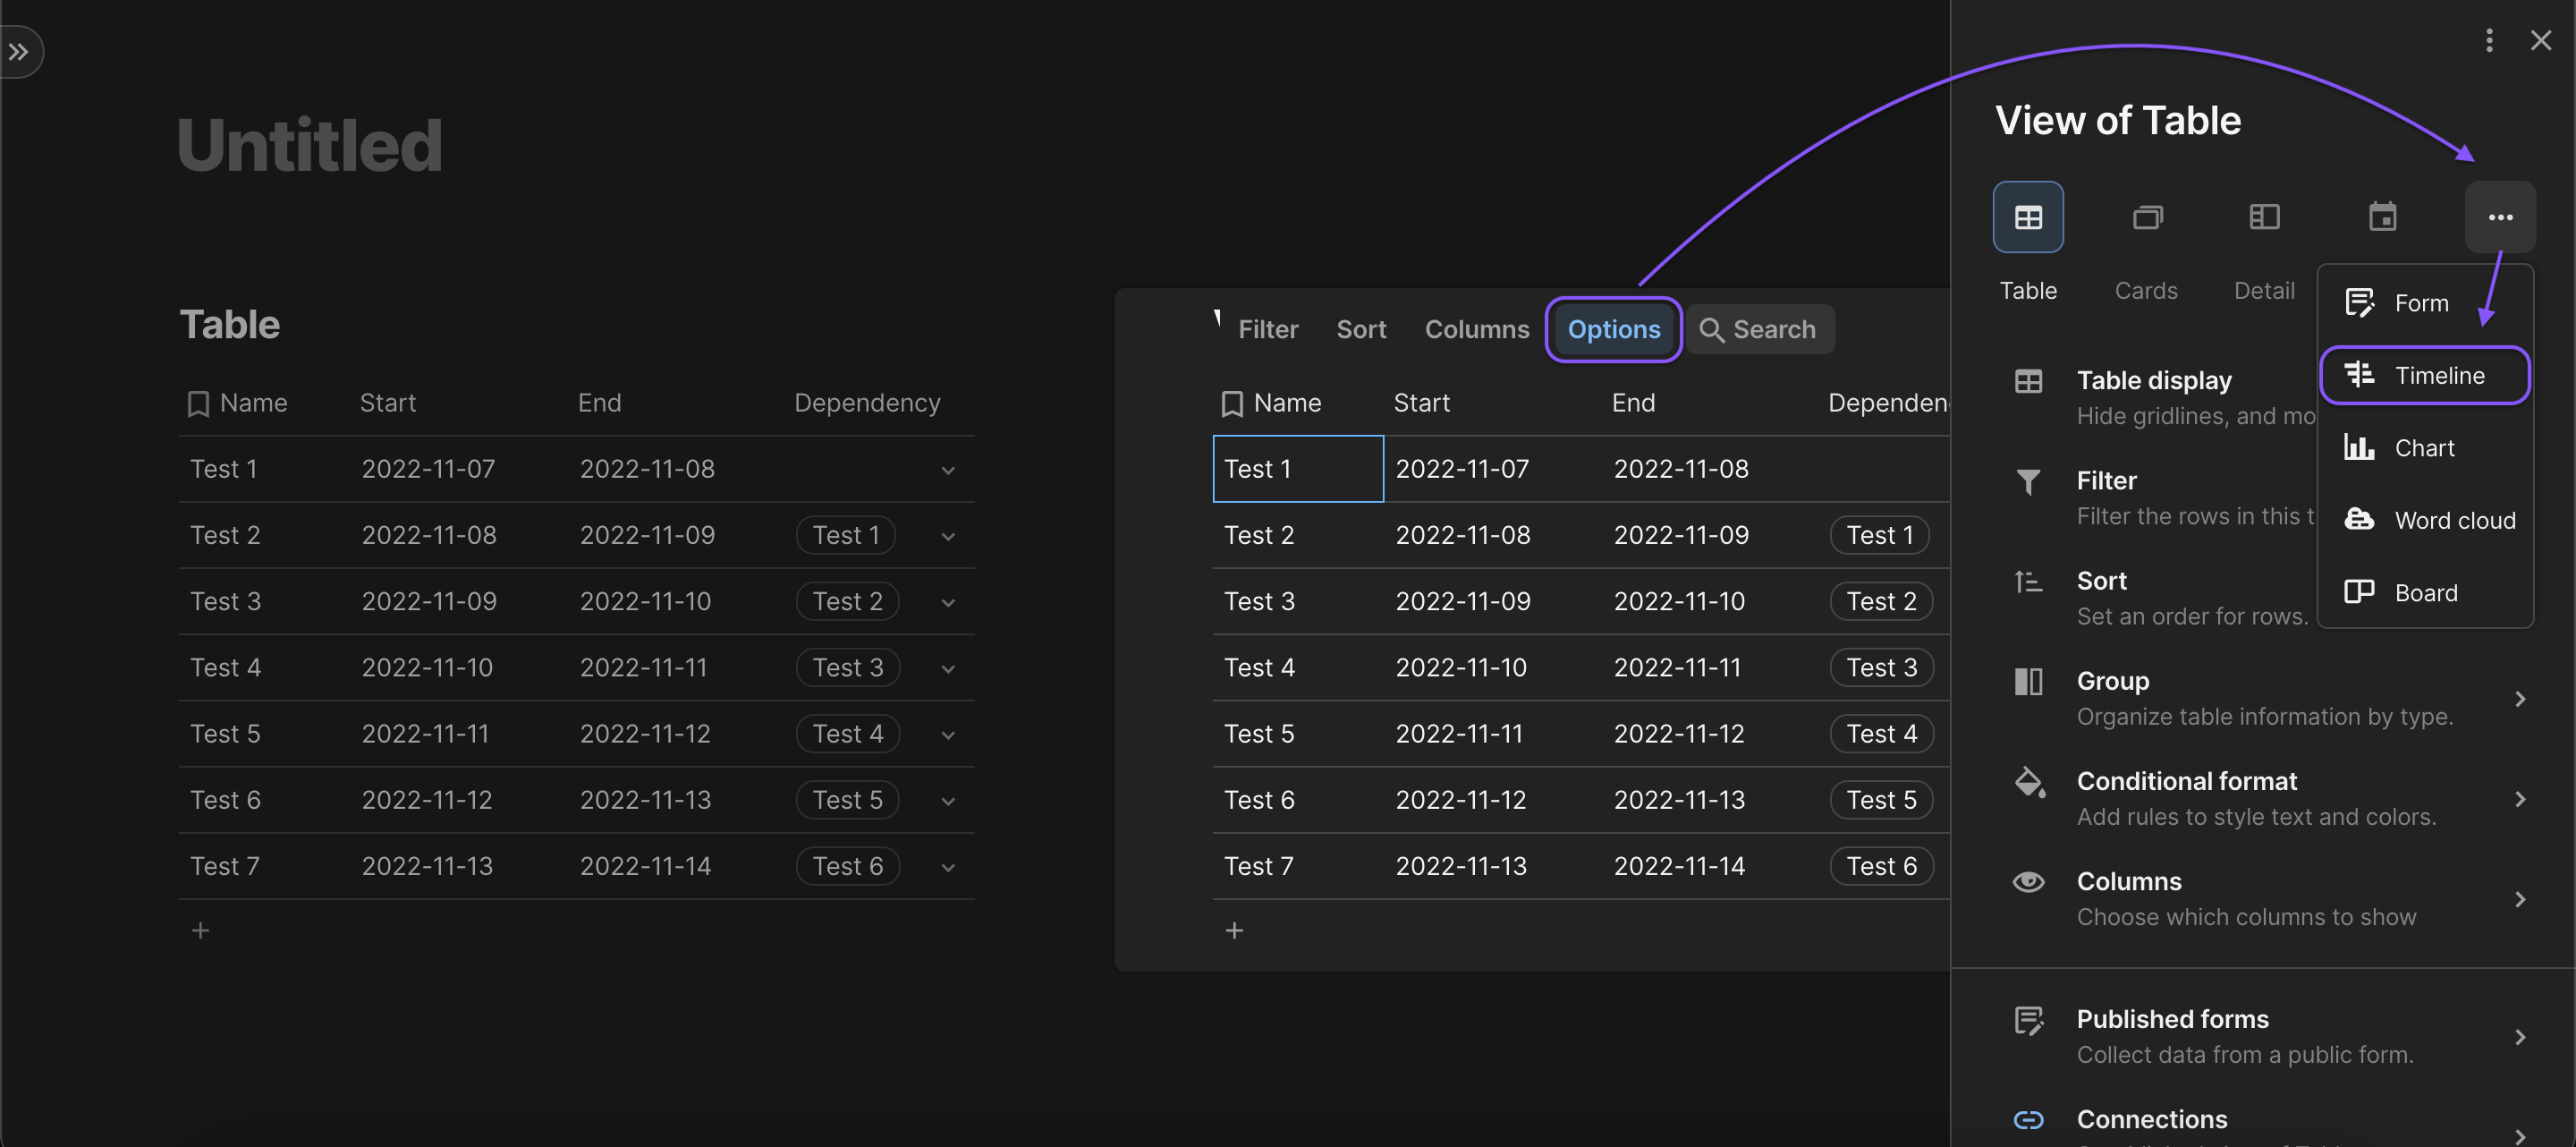
Or you can find the option in the Options(![]() ) of a table/connected view, then in
) of a table/connected view, then in More you’ll find Timeline ![]()
And once there, you’ll be able to configure your “Timeline”/Gantt Chart as desired ![]()
Note that for the “Timeline”/Gantt Chart display to work as expected, you would need to have a table/view with either a start date (or date/time) and an end date (or date/time) or a start date (or date/time) and a duration for each event you want to display in the “Timeline”/Gantt Chart ![]() (An optional dependency field can be added too)
(An optional dependency field can be added too)
Hope this helps ![]()