Since we launched our publishing features and Doc Gallery earlier this year, so many amazing docs have been published by incredible Makers. We know you have no shortage of options for where you share your ideas, tips, tricks, and recommendations, and we know it’s important to be able to measure the impact of sharing them via Coda.
Today we’re excited to share two new ways you can get insights on your published docs: Coda’s new publishing analytics, and an integration with Google Analytics.
This sample report contains some fun docs from one of our marketing team members. Feel free to show them some likes and love by searching in the Doc Gallery if you have time!
Coda’s Publishing Analytics
I’ll cut right to the chase, like a lot of resources as Coda, we built Publishing Analytics asーyou guessed itー a doc! If you’ve published a doc, you can generate a custom Publishing Analytics Doc, which contains metrics, dashboards and benchmarks only for your unique docs.
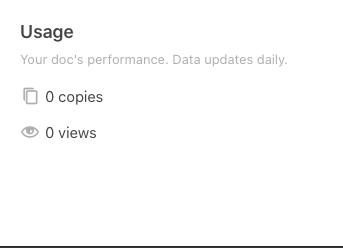
Your publishing analytics doc will include summary stats for all of your published docs, including sessions (total, as well as broken out by desktop, mobile and other devices), likes, copies, views and copy/view ratios. You’ll also be able to see a summary of the publishing settings for each, including discoverability, whether you’ve enabled the option to earn credit from your published docs, and more.
Within the doc, you can also navigate to Pages for Insights (a “highlight reel”-esque leaderboard for your docs), weekly metrics, daily metrics and a glossary of terms used throughout the report.
Tip: The doc updates daily, so we recommend bookmarking it to your ‘My Shortcuts’ on your doc list to easily check on your stats at regular intervals.
Ready to generate your publishing analytics doc? Here’s how:
- From the editable version of any of your published docs, select Settings
- Select Statistics
- Scroll to the bottom of the panel and click the ‘+ Create Analytics Doc’ button
Google Analytics for your published docs
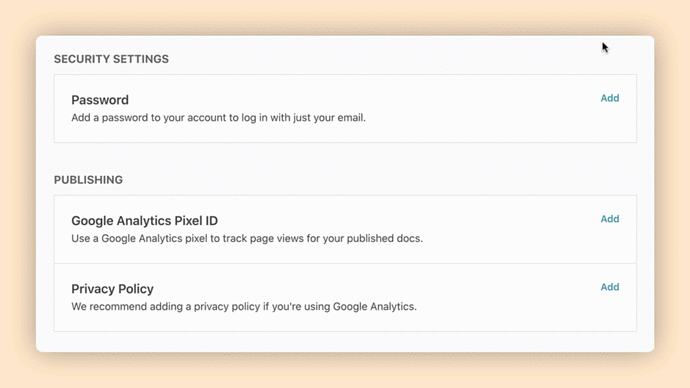
We get it ー sometimes you want the metrics for all of your content in one place! If you’re already tracking your web content in Google Analytics, you log sessions for your published Coda docs in a Google Analytics profile.
Simply navigate to coda.io/account, and input the desired Google Analytics profile ID (formatted as UA-XXXXXXXXX) for your published docs.
Tip: While we can’t provide specific legal guidance, we’ve been around the internet long enough to know that regulations related to cookies and user data vary by region, and are taken very seriously around the globe. For this reason, we recommend having a privacy policy in place if you are logging user session in Google Analytics. If you’ve already got a privacy policy for your business or site, you can provide a link just under the field where you add your Google Analytics profile ID so that it is easily accessible to your doc viewers. Want to know more? Visit this page for more details.
We hope this helps you understand how people engage with your docs, and gives you more data to make more decisions as you publish more incredible docs!


