I am a very inexperienced user. I am trying to make a formula that returns an output in one column if a number in another column is between 1 and 2 and I can’t work it out. I can get it to work for greater than or less than but not between. THink I am missing something very simple.
Also I would like a column to return a number that equals a number in another column less the number above it in the column if anyone knows how to do that?
Sub 1) the formula should look something like this: if(columnValue>1 AND columnValue < 2,"A","B")
Sub 2) you are thinking spreadsheets here. Yes, it can be done a couple of different ways, but it is tricky: if you sort your table differently in the future, the formula will break or give you perhaps some unexpected results. If the sorting (or filtering) is not going to change, you can get the value of the previous row by filtering on RowID or rank.
The best thing for you to do is to make a representative document without sensitive data and share it with the community. In your doc we can show you how to do things.
What I meant with thinking spreadsheets: a table is not a spreadsheet. I ran into similar situations when I got started with Coda and eventually I figured it all out. But these days I hardly ever have to resort to ‘previous row’ formulas, because most of the time there are better ways to work with your data.
I am trying to get the Superhomes ratings columns to return a 0-5 star rating depending on the values in the TCO2 column and the same for the space heating column.
I understand what you mean by spreadsheet thinking, unfortunately the data I get for the first 6 columns is generated by other software used to calculate energy efficiency in buildings so I only get it as an output in a spreadsheet style. I am then using this to add further information.
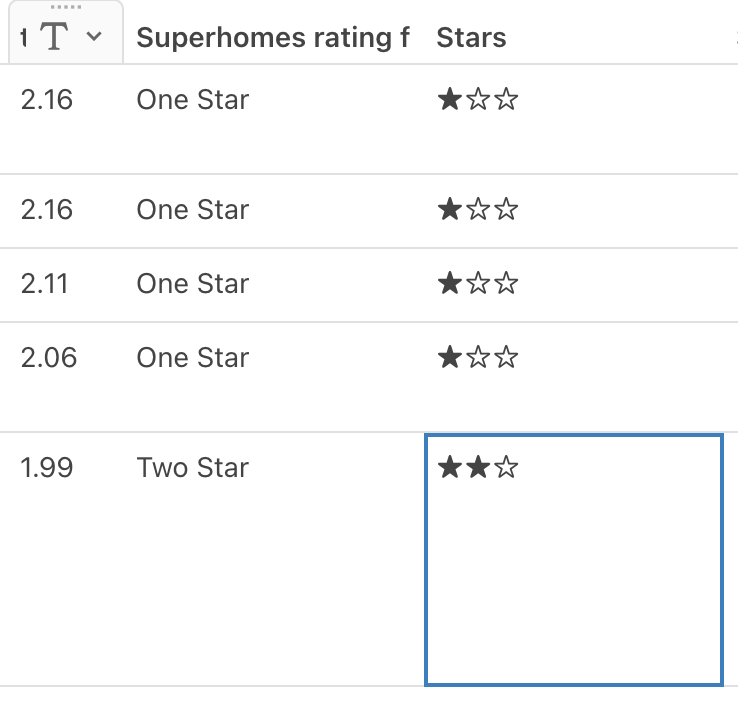
I fixed your formulas a little bit so that you are actually outputting information. And gave you another way to display star ratings (with actual stars!! )
Hi Scott, that’s great, I thought you might be able to do Stars but hadn’t got round to trying that.
I am trying to show how changing a house can affect it’s Superhomes rating, this is based on 2 variables, tonnes of CO2 and Space heating demand. You need both to get the rating but I want to show them seperately so people can get an idea of what improvement will affect the CO2 or the heat demand. The ranges are as follows:
It’s an interesting project and I am rather sure that it will be possible to make such a tool.
Worth spending some time on this to get an idea of the direction to go and the effort it will take to learn to make it.
The community is a great source of knowledgeable members that can advise on how to overcome certain challenges, but not to solve a whole project.
Of course, you can always request to build your project against a to be agreed compensation, but I would recommend to learn to build, enjoy the journey and be future proof.
Hey @Alex_Woodcraft ,
You actually needed a scale, so I put an extra column in your doc, it’s called real stars.
The formula didn’t require the AND operator, because the switchif() ends when a condition is met.
You needed to find the value for a previous row - I can’t find a description in your doc for this problem, so I can’t give you a pointer to a solution until I know what you are trying to do.
Also, when I said you are thinking spreadsheet style, I didn’t mean that your table can’t look like a spreadsheet, I only meant that Coda has much better solutions to get the value of a previous row than pointing to something like B7. So even though the data is coming directly from a spreadsheet, you might have to change your ways a little bit to retrieve the data you want to work with.
So please be a bit more specific as to what you want to do and we can probably help you.
Greetings, Joost
That works really well and is very simple and elegant, I was hoping it would be!
My other dilemma is working with the fuel bill and TC02 columns. I want to show in the report how much money and carbon each improvement will save. I am showing this in the Annual fuel saving and Carbon saving columns but I am calculating them by hand and inputting the figures and am hoping I can automate this somehow.
Anyway, thanks very much for your help, I am pleased to have learned something new.
I added two more rows, one with the row ID and one with the function for the calculation you were looking for.
The little if statement is only for the first row, because otherwise you get a really strange result because there is no previous row (or you could have started with a blank row, but that is kind of odd).
Please realize that this is for illustration purpose only. It works, but it is error prone as you will more than likely add/delete rows in the future. RowID() stays always the same, regardless of its place in the table, so that gets tricky really quick. Ranking on Energy rating is not the answer either, because these are not unique values (and to use something like rank() you need unique numbers, as shown in another extra column).
If you can make a subnumber (can be hidden for the user) that you manually adjust, like 71C-01, 71C-02, etc., you can use Rank() on that compound number (and do your calculations bases on rank instead of rowID). Working that way allows to set it up properly now in a way it keeps on working when adding, deleting, or changing row positions, in the future. The only manual part in the future will be to make sure the subnumbers will be correctly applied. At this point there is no good way to do that any different.
I hope you are one step closer to a working app,
Greetings, Joost
Thanks Joost, will have a play with that and see what I can do. These tables are used as part of a report so don’t change much once I have all my answers so your solution could be fine. I will play with it and improve my understanding.