From this sentence, I assume that by Values you mean Columns
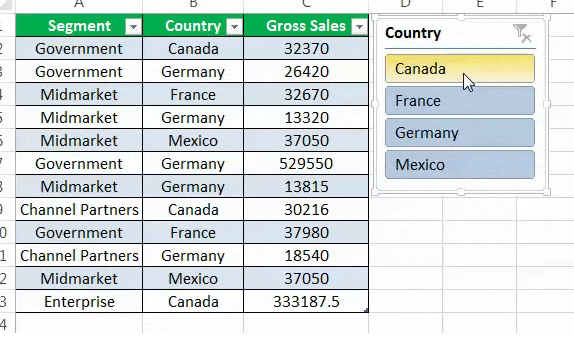
You think of having a chart that allows you to consider the whole column ranges and you can interact with its visualisation by de/selecting them somehow (either with a slider or whatever).
Currently you have to select/delete each of them manually in the chart interface.
Unfortunately I’m not seeing another way of doing it, at this time.
But please, tell me if I’m still far from your thoughts