Launched: The new filter bar improves the way teams interact with data

In a collaborative workspace, it can be tricky to balance individual needs with the needs of the team. You want a single space to store your data, but each team member may be interested in a different part of it. With the new filter bar, everyone can work with exactly the information they want—without disrupting anyone else.

It’s the next step in our effort to help you handle your data your way. In March, we launched the ability to search information in a table without updating the view for other collaborators. In July, we introduced personal canvas controls, which allowed anyone to filter data against a single set of criteria, just for them.

And now, the flexible filter bar at the top of your table lets you choose desired values from any number of columns. Each team member can easily create their own customized view of the same table at the same time, and change it as often as they’d like.

FilterBar1.gif

If you set default values, team members can change their filter criteria as much as they want, then return to the original view with one simple click.

FilterBar2b.gif

Here’s how to set up a filter bar in any table in just a few moments:

  1. Hover over the top right of your table and select the filter option to open the side panel.
  2. Toggle on enable filter bar, then navigate to the desired column that contains data you’d like to filter against, if it’s not already visible.
  3. Select the eye icon next to that column to make it appear on the filter bar. If you’d like to remove any columns from the filter bar, select the eye icon again.
  4. Set any desired default values by selecting the gear icon next to the column name. This filters the data against the default values for every team member, but any further changes they make in the filter bar will only impact their view.
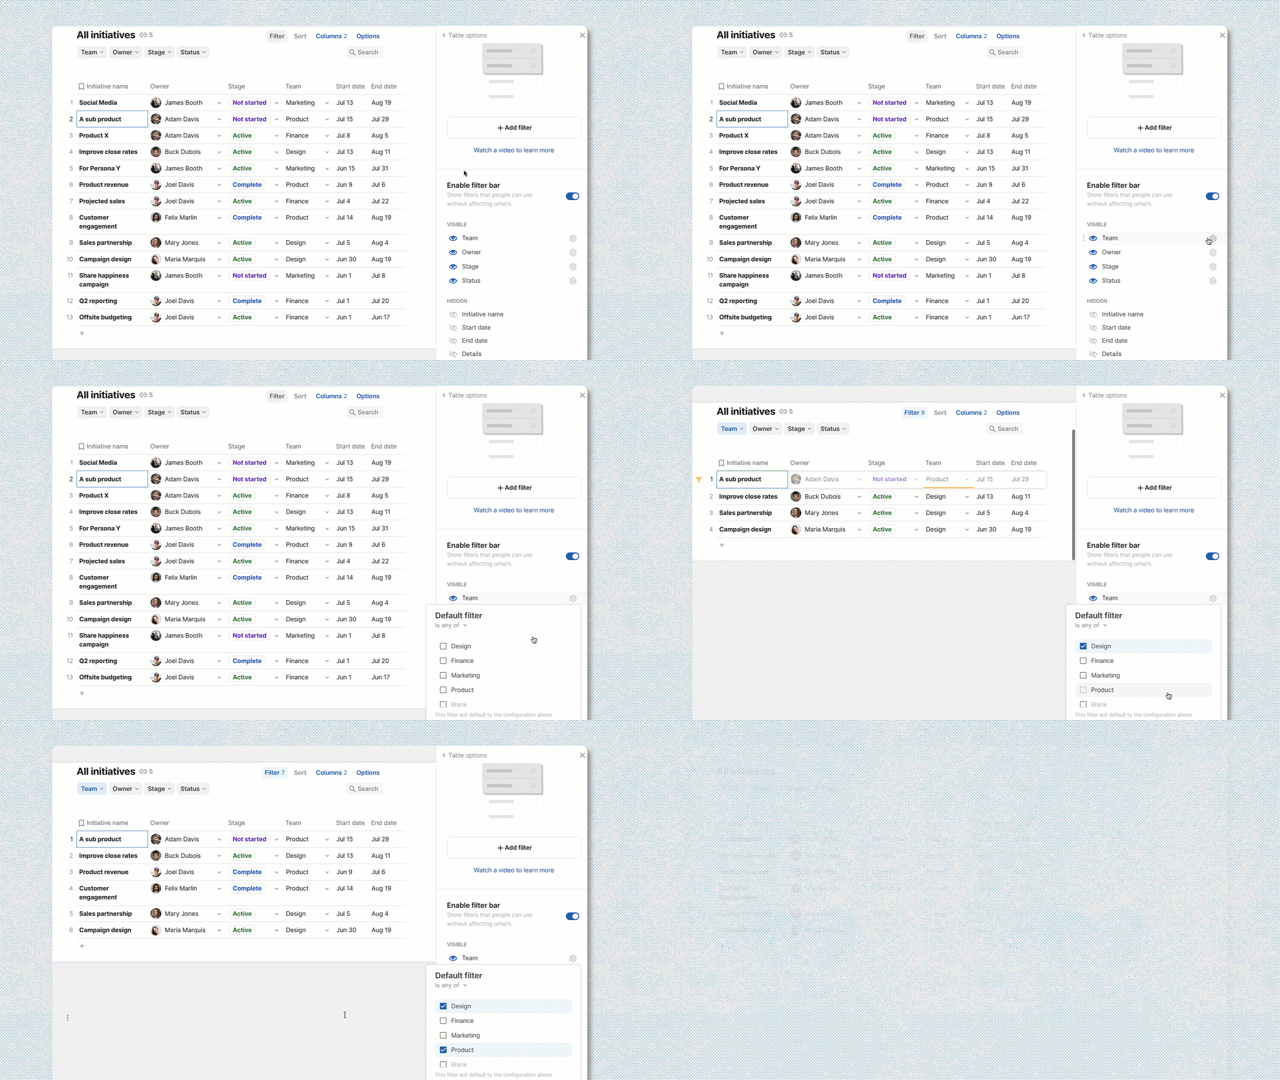
FilterBar3.gif

You also have the choice to always show or hide the personal table search, so you can further customize how your team can best find what they need.

SearchBarOptions.gif

With these new flexible filtering tools, every member of your team can access data and work with it exactly the way they need—without disrupting anyone else’s work—so your tables can grow with your projects, goals, and team.

Want to see this in action? Copy our initiative tracker template and add a filter bar to your tables. And if you want to learn more about using filters, filter bars, or canvas controls, explore our help article.

36 Likes

Absolutely fantastic!
Saving so much time everywhere. Bravo Coda team, keep it up!

6 Likes

That’s such a good addition! Minimalist doc and more real estate :fire:

3 Likes

This is huge for me. Thank you!

2 Likes

This is amazing!

Is this supposed to work for existing docs that already have filters or only new docs and/or ones without filters? I don’t seem to have the option to turn it on in my current doc.

Thanks.

Never mind. It just showed up :slight_smile:

It should be available for all docs. If your doc has been open for a while, you might need to reload the page to get the option to turn on the filter bar.

1 Like

@Paul_Wilkins yes! That’s exactly what happened :). Thank you.

Great! I hope you enjoy using it!

1 Like

My CEO is going to love this :slight_smile: . Thank you!

1 Like

@Paul_Wilkins is the thinking that this will replace all filters–both regular ones and interactive ones–or just the interactive ones?

I’ve been using regular filters for table or view presets and interactive ones for anything else, so I’m trying to figure out if I should just convert everything to the new bar, and if there are pros/cons to doing so.

Obviously any filter with a formula needed would still go via side bar…

Thanks in advance.

Great question! When you apply a regular filter, it applies for everyone and can’t be changed except via the filter panel. When you set up the filter bar with default values, any user can modify the filter for themselves only, then use the reset button to return to the default.

In general, if you want to narrow your data down for everyone and never show data outside that filter for anyone in that view, a regular filter is the way to go. If you want to narrow the scope of data you display by default, but allow users to broaden their exploration beyond the limits of that filter, setting up the filter bar with a default is a good option.

Note that regular filters and the filter bar can also be combined: in that case, only rows which pass the regular filters and the current filter bar settings will be displayed. This can be useful if, for example, you want to narrow the scope of data displayed in the view, but then allow users to freely explore the data within that scope.

Finally, if you want to set up a filter across multiple tables/views, canvas controls (formerly referred to in-product as interactive filters) are the best way of achieving that. For scenarios involving filtering on a single table/view, using the filter bar will usually provide the best experience.

I hope that guidance is helpful: if you have any follow up questions, please don’t hesitate to ask.

4 Likes

Thank you. That’s super helpful!

1 Like

Excellent!
@Paul_Danyliuk, now we can let go of your incredible workaround, :hugs:

1 Like

I really like this tool! So quick and easy! The only issue I’m having it is not showing the correct “Summarize” values for a column…

This :clap: is fantastic! :clap:

@Paul_Wilkins one more question. Is there a way to set this to be enabled by default across an account and/or doc?

Hi Marc,

Thanks for your report. We’re actively working on a fix for the summary value issue with the filter bar.

There is not a way to have the filter bar enabled by default right now, but I’ll definitely make note of that as a suggestion/feature request.

Thanks. Also, it would be great if you could borrow the filter bar from another view, so you don’t have to duplicate the same one over and over :).

2 Likes