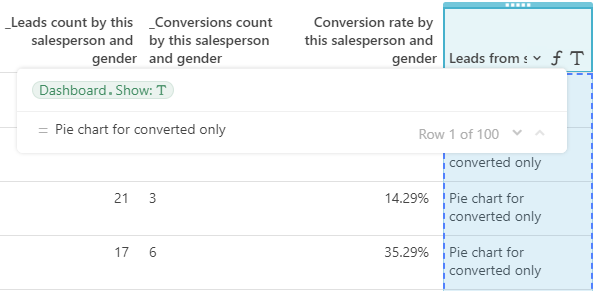
Create a table with a single row. Pull in all the data you need into columns. Each dashboard element (a chart, a table etc) — a separate column. By pull I mean either import the whole table or some filtered subset:
Make a Details view out of that table. Go to Customize Layout, and select Quick Style 3:
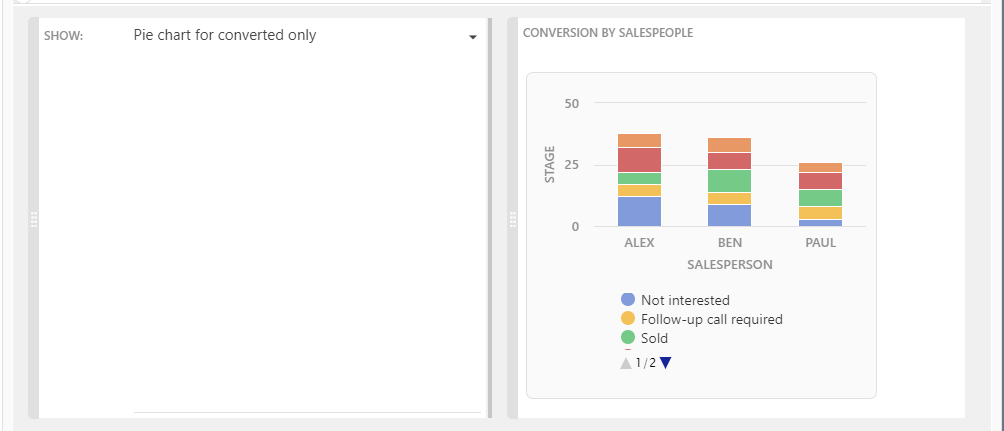
Quick style 3 has one big advantage: you can have two equally wide columns that flow independently. If you don’t use Style 3 but simply put elements one besides another, the shorter one will resize to fit the height of the taller one, and you may not want that:
Style 3 will draw a vertical line between columns, but I guess you can live with that.
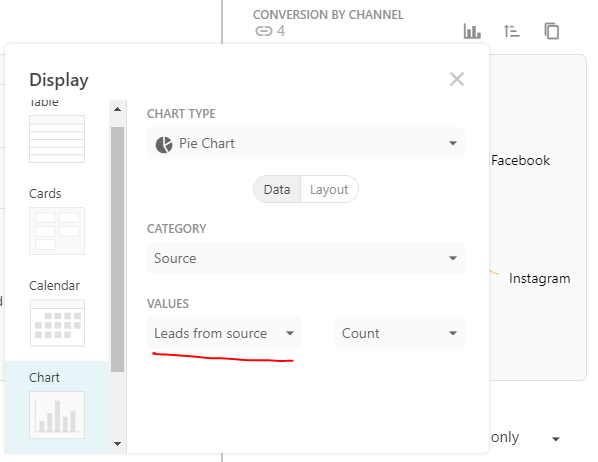
PSA: for all those nested elements, you can actually use charts, nested detail views, calendars, cards etc, not just tables! You can virtually do anything that you’d do on the canvas. There’s no filter dialog, but that’s what the .Filter() in the lookup formula for.
Mad props to @Francesco_Pistillo for surfacing this functionality to me. Too bad his post from half a year ago that went totally unnoticed. I’m just helping to resurface it here.
One more reason to name when persuading your teammates to migrate from spreadsheets to Coda
Demo (best view in separate tab)
And don’t forget that this exists too
Please subscribe to codatricks.com if you haven’t already — I’ll gather all the tips and tricks I’ve discovered under one nice blog… when I’m done with all the freelancing assignments and have time to finally author it
Excellent hint, @Paul_Danyliuk!
I’m amazed and I’ll try to do some experiments very soon.
Great tip!
However, I believe that a free floating layout to build up a dashboard is definitely something that - better sooner than later - should arrive from Coda.
Guys, @Paul_Danyliuk@Jean_Pierre_Traets
Thank you very much for the credits … I wasn’t expecting that an innocent trick I made half a year ago would have gained so much attention…
Collaboration and recognition are two aspects that make this community super awesome!
Thanks again @Paul_Danyliuk for bringing this back. I’ve been using this approach for some time now and it works…it has some limitations though and I’m keen to wait some announcements from Codas about free layout in Canvas
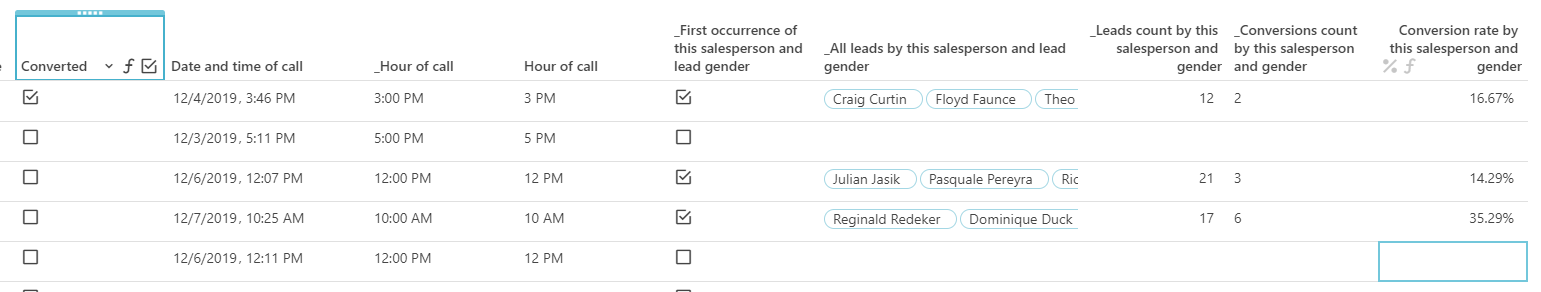
Updated the sample to not require a [manually created] derived aggregation table of salespeople and gender — implemented the aggregation within the Leads table, so that when new salespeople are added, there’s no inconsistency risk. It’s not great data design, but a trick with its benefits and tradeoffs:
Hey Paul (or @Francesco_Pistillo), this is a great trick! One “off-label” use I tried for this was to embed a Todoist.com URL into a field. Using the width and height parameters, I can force the Coda field to expand to incorporate the site in the Table format (or in the Canvas of course), but that doesn’t work in the Detail format (even in Style 3). I queried Coda’s support team and they confirmed it’s not currently possible but they’ll add as a feature request. Do you have any ideas or suggestions for a potential workaround (somehow tricking the field container to expand) to make it work in Detail? Thanks!
I can make the field container expand by concatenating the iframe with a tall Rectangle() — however it doesn’t make the iframe taller (it just lingers in the bottom of a tall wide field). Seems like the iframe’s height is just fixed in layout view.
Thanks for trying, Paul. I’ve also managed to achieve the desired result by using two tables on the same section. The first – in Detail Format – displays all the row’s fields except the embed. The second is a one-row, one column table containing the embedded URL. Using the interactive control I can keep them in sync… Inelegant, but functional for the time being.
Hey @John_Beaudoin_Jack — I updated the answer (you probably didn’t see it because only the first version got sent by email), and I actually did find the solution. See the community post. There’s a video too.
recommendation: as you make your Youtube videos, adding the Discourse URL to the Youtube video description will help others connect to the context behind your genius
no need to be so hard on yourself. You are already doing 80% of the work for blog posts here in Discourse. Just take your favorite posts from this community and paste them [without editing] into http://codatricks.com/. Even if you never “have time to finally author it” you will still have the best Coda blog on the internet.
Thanks @jeo! Regarding the blog, it’s my perfectionism that kicks in. However you’re right — I’m posting a lot on the community lately as a way to get that first draft out.
I have done this for my sprint stats but I found that interactive filter doesn’t work until I go to layout edit and back (even with no changes) - filter just don’t update! I have this kind of filter for my charts and when they are pasted in Detail View like described above - the filted doesn’t work
Yeah, this is a bug, I reported it to Coda a few days ago.
In my dashboard sample, the control for pie chart affects the column values, not the filter. I think there may be some workaround but I haven’t looked into that yet.
UPD: The workaround would be to add a column to your sprint’s table that would simply pull the value from the select from your dashboard (e.g. same value for all rows if all you need is just a count), then make your chart dependent on that value. Then it will re-render when the select is changed:
This is great! I’m getting stuck at the very beginning though. I created a Dashboard table in tables mode. For the first column, I want to see my Checkout Status Chart. I don’t know how to pull in the chart. I’m getting just the status that power the chart (e.g. Available, Not Available). How do I get the table into the cell?
You’re pulling row references, right? And the column is of type Lookup, allow multiple values, and the correct table? Then you should see the Table toggle as in my previous reply in this thread.


 , it gives me the opportunity to learn something new.
 to
to  … I wasn’t expecting that an innocent trick I made half a year ago would have gained so much attention…


 I have this kind of filter for my charts and when they are pasted in Detail View like described above - the filted doesn’t work