I have a relatively easy question that somehow I am getting stumped by (I think it’s my transition from Excel to Coda).
I have a table with the columns: Project Name, Q1 Revenue, Q2 Revenue, Q3 Revenue, Q4 Revenue, Total Revenue.
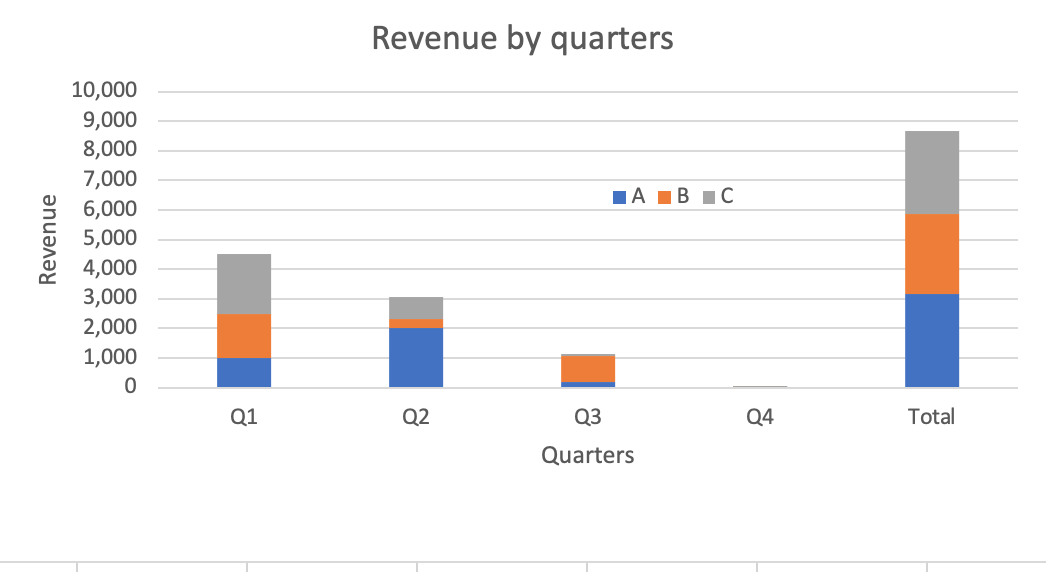
I’d like to show this in a bar chart with revenue on y axis, quarters and total on the x axis, and then ideally each bar could be stacked by in different colors by project (like below, created in excel).
I added a view of the table with some running total columns that you could reference. There is a way to stack records, but I’m not quite sure how to make that work with your table structure.
An alternative structure would be to have key/value pairs with a project column and a quarter column. I tried that but stacking the records doesn’t give you any sort of running total. If you were to use a running total combined with that, I think you could get it to work, but you might not be able to get it to segment by the contribution of each quarter.
I’m sure there is a better answer than this though.
Ok - that’s easier and makes sense. I’ve made that alternate table with the revenue by quarter with a row per project per quarter. This allows for proper segmenting and stacking.
My understanding is that you wanted a running total of revenue by product by quarter. I’ve added another table and chart below that you can reference.
There doesn’t seem to be a grand total capability, so you would need another “quarter” for the grand total.
Thanks for the thinking on this JonO but this alternative wont work for me. I want to have one project per line and enter revenue with start date and end date. I can then separate it into columns to get the quarter output.
Hello @Andrew_Foote!
I modified the Coda you shared and added another section with roughly what you need, take a look!
Coda works best when you follow some principles of database design, so I designed the schema that I think will work best for your case.
I couldn’t manage to get the total bar at the end tough
I really like the view at the top! However, the challenge is right now the UI is quarter centric. I’d like it to be project centric if possible. (i.e. i’d like my team to enter the project start, end date, and total revenue, and then it can be amortized over the lifespan of the project. We will have a 20+ projects (that last anywhere from 12-36 months, start and end dates change regularly) so entering revenue by quarter wont be possible
It seems I need a way to formulaically transpose the data? Or could sub tables work in this case? Overall this seems like a pretty straightforward use case and thinking there should be an easier solution - Keep the ideas coming and appreciate all the support so far!