One thing I particularly love about Coda is that it lets me quickly build simple productivity tools to help me with my mess of a life. Just now I was thinking of building a “where did my time go” tracker. I wondered if it was possible to visualize my day as a multipart progress bar with work, break, and procrastination periods as differently colored sections (interleaved, not aggregated).
Yep, it’s possible! You can use .FormulaMap(Rectangle(…)).Concatenate() on a list of rows to get a nice continuous progress bar, and set each Rectangle’s width and color based on CurrentValue.
Demo (play around with the table):
I’ll make and share the complete time tracker a bit later 
24 Likes
Dear @Paul_Danyliuk,
Another master piece of creativity 
1 Like
Thanks @Jean_Pierre_Traets, you’re too kind 
I love this! I especially like how concatenate merges the gap that would otherwise occur when putting two rectangles next to each other.
I prefer the gap though, looks cleaner and also allows you to be more creative with colors. I think this can be helped by adding spaces or small rectangles between the real ones (with a nested Concatenate)
3 Likes
This is amazing @Paul_Danyliuk!
Having fun with it: 
7 Likes
Hooray! you are brilliant! Many thanks. I’ve been looking for this! I’m an author and I can use this to graphically see the length (word counts) of the chapters of my book!
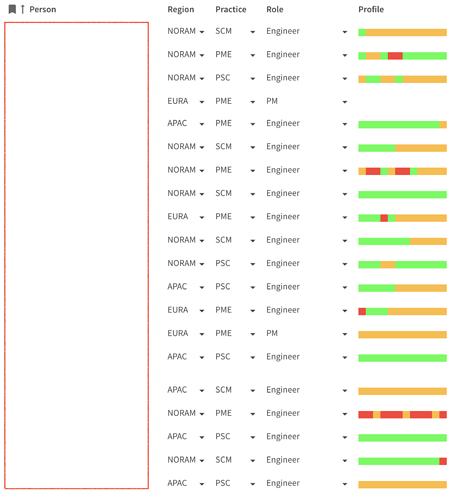
Loving this, too.  The bar shows how many hours each engineer is allocated to projects each week for the next quarter. Red is over-allocated (>40h per week), green is comfortably allocated and amber means has availability.
It gives you an at-a-glance indication of who’s busy and who isn’t.
5 Likes
Well, the mechanism behind the LCD panel is pretty much the same — table-backed multi-part progress bar with line breaks and gap rectangles between display rectangles 
3 Likes
I’ve been playing around with this. It’s no Snake, but here’s where this method has taken me:
A Gradient Generator for adding a little pizzazz to your docs ↓
17 Likes
Wow! This is cool! Reaching new heights and color!
1 Like
I’m surprised by how fast this one renders!
1 Like
Amazing work! Was trying to set this up on a page I am creating that looks to have a progress bar that has a color for deals “Closed,” “In Review,” and “# of Open Discussions.” I am having issues with the formula and tried a handful of things. Was hoping you could assist with a breakdown of this.
-
Would I create four columns - progress bar, closed, in review, and # of open discussions and then have the formula in the progress bar column?
-
If so, what formula would I use? What goes inside the .FormulaMap(Rectangle(Closed.In Review.# of Open Discussions)).Concatenate(WHAT GOES IN HERE?)
Unsure if the columns would go in the first set of parentheses and then what goes in the ones after Concatenate.
Would love help if possible as this is pretty amazing!


